Credit
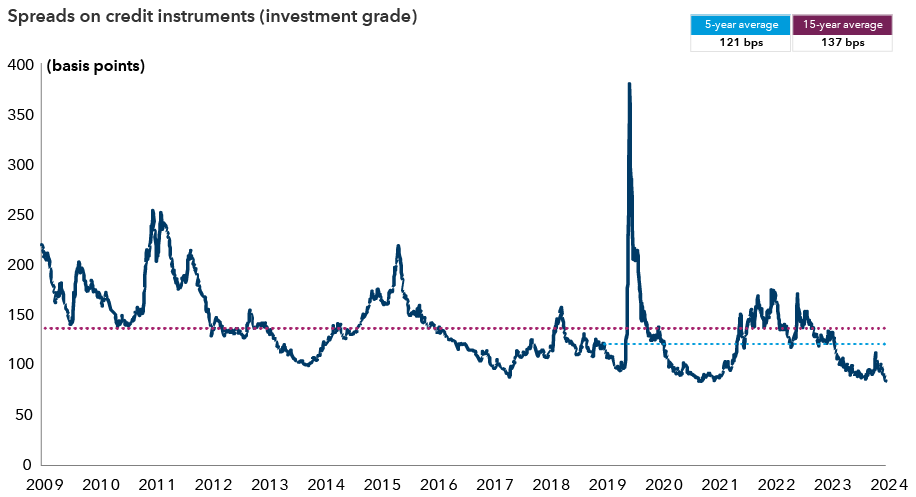
As the Federal Reserve embarks on a new easing cycle, the outlook for the global economy, geopolitics and monetary policy remains uncertain. Financial market conditions have improved over the past year, suggesting a reasonably high probability of an enduring benign growth environment. But the possibility of recession and weakening corporate fundamentals also looms. Against this backdrop, valuations in corporate credit are trading near historically tight levels.
IG credit spreads remain near historically tight levels

Source: Bloomberg. Bloomberg U.S. Corporate Investment Grade Index. Data as of October 9, 2024. Investment grade: BBB/Baa and above.
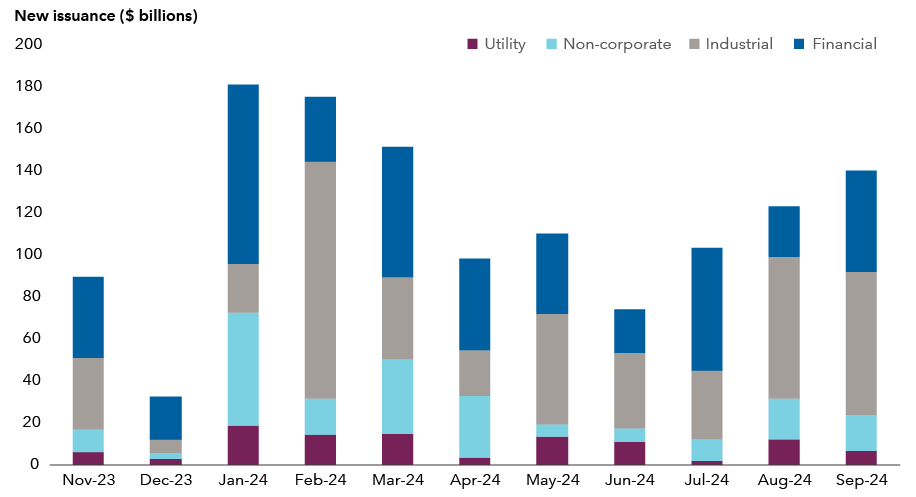
It is difficult to build a portfolio that outpaces its benchmark in every environment, but there are actions investors can take to potentially improve the odds. Investors can find relative value in the investment grade (IG) corporate bond market in most spread environments. The constant pace of issuance, shifting corporate fundamentals and purchases and sales by passive funds create dislocations in credit spreads to individual issues and issuers. Although the opportunities are not evenly distributed, investors can add value through idiosyncratic issuer selection, so long as they are able to take a long-term view, maintain price discipline and develop insights beyond the consensus.
New issuance varies across corporates

Source: Barclays, IHS Markit. New issuance in high grade credit. Data as of October 9, 2024.
The idiosyncrasies of relative value
Some investors believe investment grade bonds are efficiently priced and the best way to deliver excess returns is to try to build a portfolio with a consistently higher yield than a respective benchmark that an investor may be comparing their portfolio to. While the approach may have had success, it can lead to being overweight risk when investors are not adequately compensated for that position.
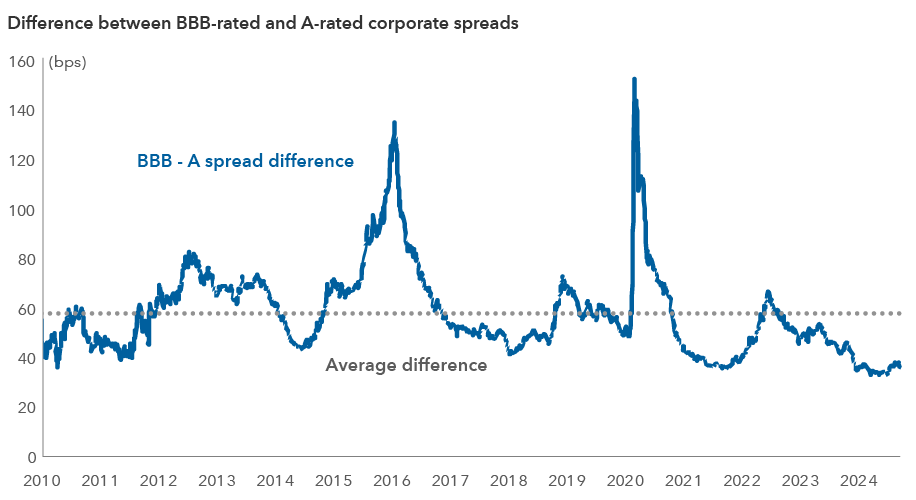
When corporate bond spreads are uniformly tight as they are now, they tend to converge across ratings cohorts. Recently, spread compression between triple-B and single-A rated issues has been one of the most important dynamics in the market. Demand for high-quality yield combined with positive U.S. economic growth has pushed the difference in spreads between these cohorts to their tightest levels since the global financial crisis. Similar spread compression has taken place between double-B and triple-B-rated issuers, leading some traditional high-yield buyers to increasingly invest in the investment-grade market.
As a result of this compression, investors reaching for yield may add to riskier credits when compensation for that risk is relatively low. As the normal course of the economic cycle unfolds, whether this is a normal cycle or not, spreads are likely to widen, with the spreads of lower rated credits generally widening more than higher rated issuers. Investment grade portfolios attempting to gain more yield by adding credit risk could be disadvantaged and may significantly lag the index if spreads widen.
The spread premium for holding riskier U.S. IG bonds has dropped

Source: Bloomberg. Data as of October 9, 2024. Indexes used are the BBB and A subsets of the Bloomberg U.S. Corporate Investment Grade Index.
Look beyond ratings: Not all credits are built the same
We can all succumb to the lure of thinking in generalities or aggregates. However, market assumptions often hide some important differences. For example, investors tend to assume bonds with similar ratings can be treated as interchangeable. But not all BBB+ issuers are the same. A credit with a BBB+ rating that has an improving balance sheet and respected management team may have a very different level of spreads than a credit with the same rating that is facing business headwinds and on the edge of a downgrade.
Taken one step further, higher rated credits can sometimes be riskier for an investor. For example, a single-A credit issue with an impending acquisition could have more risk of its spread widening than a triple-B-minus credit issue, whose management team is dedicating their free cash to paying down debt. This is where fundamental research and understanding company management can be crucial to making an informed investment decision.
For example, within the pharmaceutical industry, several companies have issued debt in the last couple of years to support corporate acquisitions. Knowing which companies prioritize cash flow for debt paydown and the likely profitability outcomes (given their product pipelines) is important to understand the spread tightening potential for each credit. This spread tightening potential relative to a corporate index is not something that would be captured in common risk measures for a portfolio and could likely unfold over a period of years. This is why a long-term approach is so important.
Another misconception is that rating agency changes are unexpected. Rating agency downgrades and upgrades are usually anticipated by the market. Investment grade corporate bonds may rarely default, but they do migrate between ratings categories and between investment grade and high yield. Real time spreads often reflect deteriorating or improving fundamentals, so a rating change may have a limited impact on spread. As a result, spread levels can sometimes tell you more about the potential return for a security than the rating.
A mosaic of risk – creating a full picture from many pieces
When purchasing an investment grade bond, a credit investor expects to be compensated for multiple levels of risk: interest rate risk, liquidity risk, market credit risk and security-specific risk. In an investment grade bond portfolio, these risks are measured by several metrics that attempt to convey the overall risk. Yet, no single statistic fully captures the potential pattern of relative returns. In addition, commonly cited statistics assume a consistent behavior across the portfolio, which break down when individual bonds exhibit more idiosyncratic behavior.
One of the most commonly used statistics, spread duration, shows shorter duration bonds have had lower excess return volatility than longer duration bonds. However, the metric breaks down at the portfolio level. That’s because spread duration assumes credit spreads for different bonds shift in unison, when in reality, bonds with wider spreads are generally more volatile than those for bonds with tighter spreads. Thus, relying solely on spread duration for portfolio risk overlooks important nuances.
In response to the weaknesses of spread duration as a measure of portfolio risk, in 2007, analysts at Lehman Brothers proposed a new metric in the Journal of Portfolio Management. Duration Times Spread (DTS) accounts for proportional spread movements, i.e. while the spread for a bond trading at 100 basis points (bps) over U.S. treasuries may widen to 150 bps in a risk-off environment, a bond of similar maturity trading at 200 bps could widen to 300 bps. The strength of the DTS measure is that it accounts for this proportional spread widening. However, it assumes a linear relationship to volatility that may not hold true. For example, the bond trading at a 200-bps spread might only widen to 280 bps.
The option-adjusted spread (OAS) for an investment grade portfolio, which factors in issuers’ ability to call back bonds, indicates the market-value-weighted spread exposure. The OAS for a portfolio relative to its benchmark gives one more datapoint on credit exposure and can sometimes reveal a slightly different risk exposure relative to DTS or spread duration. When used in concert with relative duration positioning, OAS can verify whether credit measures are influenced more by duration or spread exposures.
Tracking error measures a security’s risk relative to a benchmark by using historical correlations and volatility environments to assess the potential return deviations. The challenge is that a portfolio that is underweight or overweight credit risk can have the same tracking error. It is also a pro-cyclical measure that may understate potential risk in low volatility environments and overstates risk in high volatility environments.
Another important aspect is how a bond portfolio trades daily relative to its benchmark index. This can reveal how various idiosyncratic positions are behaving in concert. The challenge with all of the portfolio credit measures discussed here is that they do not account for the gradual spread improvement in specific credit. For instance, if a bond’s spread tightens 40 bps relative to the index over several months due to improving fundamentals, this won’t be captured in any of the measures noted above. A portfolio that has meaningful differences in relative exposure to issuers and issues that are experiencing steady tightening or more stability relative to the overall index can deviate from the returns suggested by portfolio level credit metrics.
The bottom line: Be accommodative
In the current market environment, where spreads are tight and the compensation for owning lower rated credits is less attractive, there is little reward in taking extra risk. The founder of Capital Group, Jonathan Bell Lovelace, once said, "It’s important to be accommodating. When everyone wants to sell, you accommodate them and buy. When everyone wants to buy, you accommodate them and sell. Don’t try to get the last 5%. Don’t be greedy.”
Constantly trying to out-yield the benchmark is nearly impossible as a valuation-sensitive portfolio strategy. At tight levels, the potential outcomes for spread changes become very asymmetric with much larger downsides relative to the upside in terms of potential returns. For these reasons, portfolio strategy should be flexible. While tight spread environments still offer relative value opportunities, there are fewer of them due to compressed valuations.
These environments usually occur late in the economic cycle when valuation risk outweighs fundamental risks. During these times, relative value is often found in higher quality credits, with a relatively low cost to switch. Additionally, portfolio-level risk metrics may also be understating the true risk embedded in a portfolio. In these periods, it may be better to be accommodative to those who are still hungry to add risk and look to be accommodative on the other side when investors are looking to offload risk.
Past results are not predictive of results in future periods.
Bond ratings, which typically range from AAA/Aaa (highest) to D (lowest), are assigned by credit rating agencies such as Standard & Poor's, Moody's and/or Fitch, as an indication of an issuer's creditworthiness.
Spread widening — An increase in the difference between the bid and ask prices of a security or asset. This typically indicates reduced liquidity and higher transaction costs in the market.
Risk-off environment — A market condition during periods of economic uncertainty where investors reduce exposure to assets considered more risky, such as stocks, and shift investments to assets considered stable, like government bonds or gold.
Bloomberg U.S. Corporate Investment Grade Index represents the universe of investment grade, publicly issued U.S. corporate and specified foreign debentures and secured notes that meet the specified maturity, liquidity and quality requirements.
BLOOMBERG® is a trademark and service mark of Bloomberg Finance L.P. and its affiliates (collectively “Bloomberg”). Bloomberg or Bloomberg’s licensors own all proprietary rights in the Bloomberg Indices. Neither Bloomberg nor Bloomberg’s licensors approves or endorses this material, or guarantees the accuracy or completeness of any information herein, or makes any warranty, express or implied, as to the results to be obtained therefrom and, to the maximum extent allowed by law, neither shall have any liability or responsibility for injury or damages arising in connection therewith.
Don't miss our latest insights.
Our latest insights
RELATED INSIGHTS
-
-
Economic Indicators
-
Currencies
Don’t miss out
Get the Capital Ideas newsletter in your inbox every other week
 Scott Sykes
 Greg Garrett