Fixed Income
The enduring resilience of the U.S. economy will be a key driver of financial markets as we look to 2025 and beyond. Having avoided a recession, the U.S. is returning to mid-cycle, economic data shows. At the same time, inflation has continued to ease back towards the U.S. Federal Reserve’s 2% target, enabling the central bank to begin cutting interest rates.
The Federal Reserve opted to lower the key policy rate by 25 basis points (bps) in its December meeting, highlighting that the central bank remains comfortable with the progress on inflation while addressing a loosening labor market. Uncertainty around the incoming Trump administration’s policies, especially tariffs, immigration and fiscal policy remain key areas that could alter market expectations. This could prompt Fed Chair Jerome Powell and his team to reevaluate the cadence of interest rate reductions next year.
In this relatively benign economic environment, interest rates are elevated, resulting in yields that are attractive across the spectrum of fixed income asset classes. At the same time, yield spreads to Treasuries for most credit assets are still tight, as investor demand has remained solid and fundamentals are strong, with both corporate and consumer balance sheets staying relatively healthy.
Against this backdrop, fixed income portfolios ranging from core and core plus to multi-sector income can provide attractive entry points, as the income potential is relatively high, interest rates have room to decline, and we believe that spreads can hang tight so long as fundamentals remain supportive.
With a new administration taking charge in Washington in 2025, policies on tariffs and fiscal spending have yet to be fully articulated or implemented. As investors try to calibrate specific policies and their potential impact on inflation and the broader economy, we expect interest rate volatility to stay elevated in the near term. Nevertheless, some rate volatility is not a bad thing – it can create opportunities for active investors in duration, yield curve positioning and structured sectors such as mortgage-backed securities.
High starting yields, compelling relative value opportunities and a potential decline in interest rates provide a strong backdrop for fixed income, despite the generally tight level of spreads.
Inflation and unemployment normalize
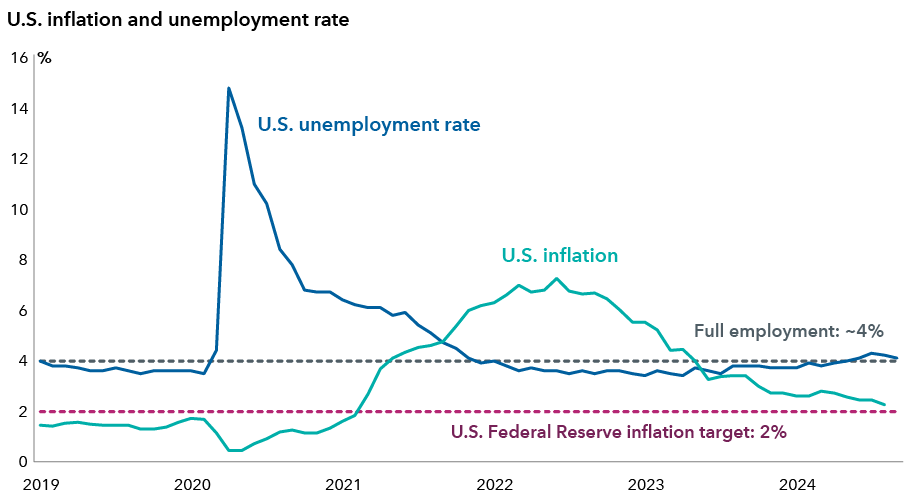
Sources: Capital Group, Bureau of Economic Analysis, Bureau of Labor Statistics, Federal Reserve, PandemicOversight.gov. Inflation measured by year-over-year change in the Personal Consumption Expenditures Index. Full employment above refers to an unemployment rate that is considered to be the lowest possible without accelerating inflation; the actual figure is theoretical, and 4% is used as an example. Data as of September 30, 2024.
Below, we provide some details on key areas of fixed income.
Interest rates are likely to remain range-bound
The U.S. economy has remained resilient while inflation eases and is moving toward the Fed’s target. Core inflation may decline further, driven by the important shelter component. Even if inflation is sticky above the Fed’s target, significant reacceleration of inflation or broad-based pressures like those seen in recent years are unlikely.
With inflation in check, the central bank appears to have turned its focus to managing risks to the labor market. We believe the Fed views monetary policy as restrictive and will likely continue lowering rates, albeit at a slower pace than previously expected.
Strong economy could keep interest rates elevated
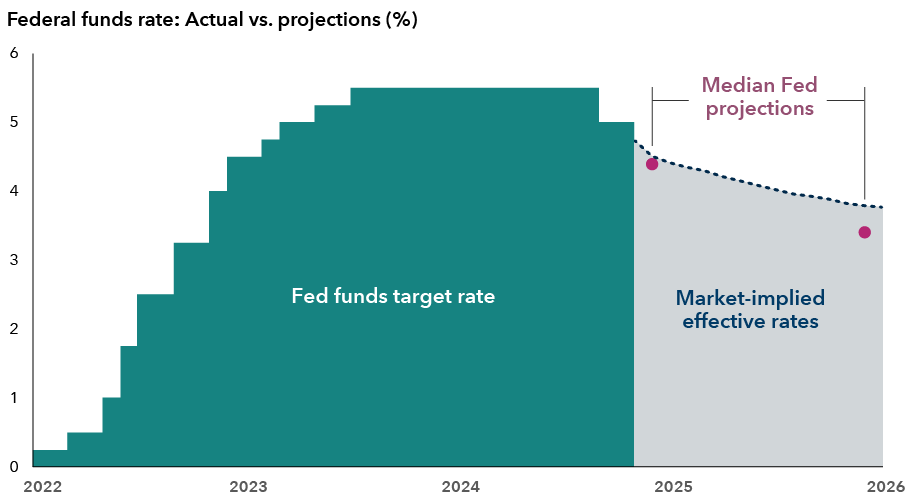
Sources: Capital Group, Bloomberg, Federal Reserve. Fed funds target rate reflects the upper bound of the Federal Open Markets Committee’s (FOMC) target range for overnight lending among U.S. banks. Median Fed projections are as of September 18, 2024. Latest data available as of November 30, 2024.
Meanwhile, intermediate- and long-term rates remain elevated on concerns that the incoming Trump administration may raise tariffs, change immigration policy and increase fiscal spending, which can be inflationary. However, there are alternative scenarios where tariffs are not as punitive as anticipated, and the new government repeals some programs and curtails others.
We are monitoring potential scenarios and expect interest rates are likely to remain rangebound. Several portfolio managers have added duration to the portfolios they manage following the sell-off in interest rates during the U.S. presidential election. While a yield curve steepener has been many portfolio managers’ high conviction, the curve has steepened considerably over the past several months. As such, managers have shifted some of their risk budget to duration positioning.
Yield curve may further steepen
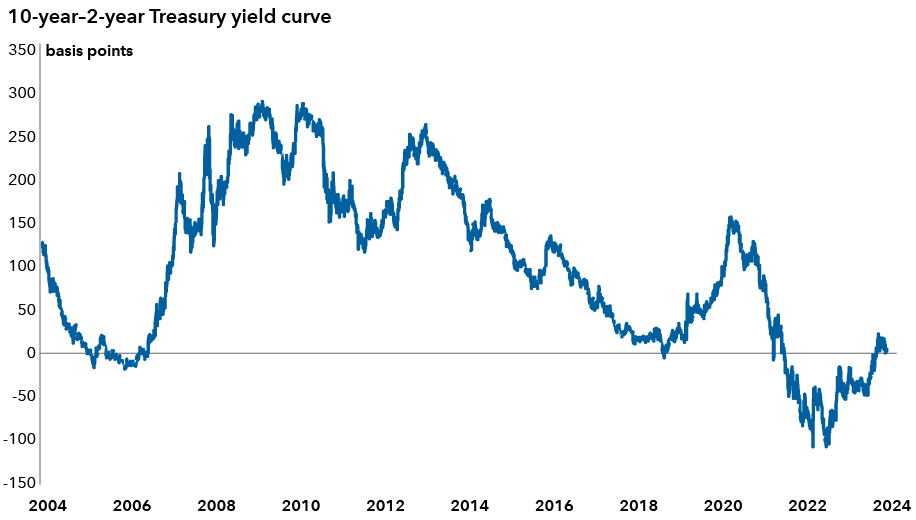
Source: Bloomberg. Data as of December 6, 2024. The 2s10s Treasury curve represents the 10-year Treasury yield spread over the 2-year Treasury yield.
Strong fundamentals and solid demand underpin corporate bonds
The positive growth outlook should, all else being equal, provide a favorable environment for credit markets, which continue to enjoy strong technical support. Although this outlook is already reflected in tight spreads, history suggests that without a significant external catalyst, spreads can persist at current tight levels for some time. Absent such a catalyst, we believe investment grade (IG) corporate bond investors can continue to benefit from the attractive yields offered by the high-quality corner of the bond market.
While near-term returns could show volatility tied to fluctuations in Treasuries, longer term returns are likely to align with portfolio yields. If economic growth disappoints, the seven-year duration of the U.S. investment grade corporate bond market should help offset any spread widening, as U.S. Treasury yields would likely decline. The only scenario where we foresee significant pressure on IG corporate bond total returns is a stagflation environment where both yields and spreads move significantly higher. However, we currently don’t view this scenario as likely.
Given the current tight level of credit spreads, security selection is key. We see opportunities in pharmaceuticals and utilities. Over the past two years, several pharmaceutical companies have issued debt to fund acquisitions designed to bolster their product pipelines. As these are generally non-cyclical businesses, they can maintain steady cash flows that allow them to reduce debt over the subsequent few years. Within utilities, opportunities are emerging from varying regulatory environments and an increase in capital expenditures to meet the rapidly expanding power demand from data centers. With less compensation for riskier credits, portfolio managers have found it beneficial to move up in credit quality.
Globally, corporate bond valuations reflect divergence between a resilient U.S. and more fragile European economies that are more dependent on China. Banking remains a preferred segment. European banks have high levels of capitalization, good asset quality and ample liquidity. Many portfolio managers favor high-quality, top-tier European banks, focusing on higher quality, higher ranked securities within their capital structure.
The spread premium for holding riskier IG bonds has dropped
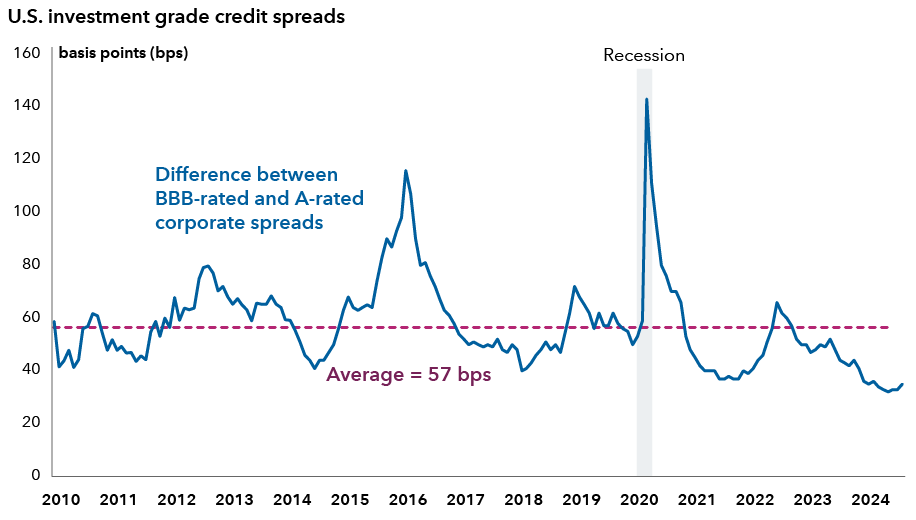
Source: Bloomberg. Data as of September 30, 2024. Indexes used are the BBB and A subsets of the Bloomberg U.S. Corporate Investment Grade Index.
Mortgage-backed securities offer high carry
With elevated interest rates and an expected rise in volatility, nominal spreads on agency mortgage-backed securities (MBS) are 100 to 120 bps above Treasuries, higher than their historical average. This makes many parts of the agency MBS market cheaper than their corporate counterparts, providing investors mid-single-digit yields on high quality assets.
With an unusually wide range in the coupon stack for agency MBS, investors can build a diversified portfolio. Higher coupons offer attractive compensation with compelling nominal yields and spreads, even if interest rate volatility remains elevated. Meanwhile, mortgage securities with coupons in the 3% to 5% range stand to benefit if interest rates decline.
Securitized credit valuations remain attractive compared to corporate credit. Asset-backed securities (ABS) provide competitive income at the short end of the maturity range. For example, investors can pick up 70 bps above Treasuries for AAA-rated rated ABS with a 1.5-year duration, backed by subprime auto loans. These bonds have robust structures that protect against delinquencies and losses, particularly in these higher rated tranches. In commercial mortgage-backed securities (CMBS), certain AAA-rated CMBS offer a 40 bps pick up in spread compared to A-rated corporates. We continue to see opportunities in self-storage and data center deals, among other subsectors, issued in the Single Asset Single Borrower market. In the conduit space, we have become more optimistic about office properties and are encouraged to see a clear bifurcation in the market’s perception and valuations between high quality and lower quality assets.
High-yield bonds are a credit picker’s market
High yield companies have largely reported healthy earnings and operated conservatively over the past few years amid recession concerns, leaving them in decent financial health. The Fed’s rate cutting cycle should provide a further buffer. Despite high yield spreads being historically tight, the resilience of the U.S. economy and improved credit quality of the sector make all-in yields are attractive. The sector’s shorter duration should also offer diversification for broader fixed income portfolios. With meager refinancing needs over the next 24 months and a positive outlook for economic growth and corporate earnings, credit losses are expected to remain low.
With spreads tight, it’s a credit picker’s market. Within the cable and satellite industries, which face long-term challenges, we have found valuations for some higher quality issuers attractive. In other areas, the potential deregulation from the new administration could create a favorable environment for M&A driven activity in the commodity and energy sectors — areas where we continue to look for investment opportunities.
Economic tailwinds support corporate and high-yield bonds
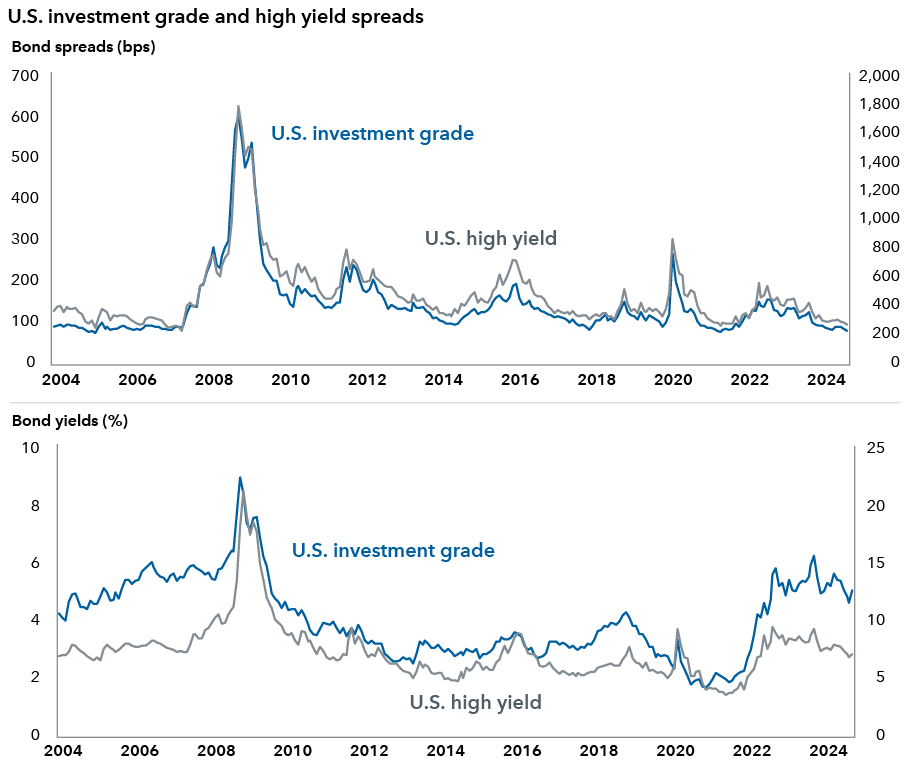
Sources: Capital Group, Bloomberg Index Services Ltd. U.S. high yield refers to the Bloomberg U.S. High Yield 2% Issuer Capped Index. U.S. investment grade refers to the Bloomberg U.S. Corporate Investment Grade Index. Data as of October 31, 2024.
Emerging market debt stands to benefit from Fed easing
The current backdrop for emerging markets (EM) seems favorable, with resilient U.S. growth combined with Fed easing. External balances for many emerging markets are generally strong outside of the frontier markets. Inflation has moderated substantially from 2022 peaks and continues to trend downward amid restrictive monetary policies. While fiscal indicators remain weak, most of the major emerging markets have lengthened their debt maturity profile and are issuing more debt in local currency, enhancing their resilience. This policy mix gives many EM countries room to ease rates and support growth if needed.
Trump 2.0 is likely to introduce volatility for emerging markets in 2025, but the details, timing and impact of the new U.S. administration’s policies remain uncertain, and they will affect different EM countries in varying ways, with the threat of tariffs being the most direct risk. It’s unclear if all announced tariffs will be implemented and how they might impact EM. Tariffs on China would notably affect the yuan, while universal tariffs will impact more open economies and those dependent on global supply chains, such as Taiwan, Korea and Singapore.
Mexico is vulnerable to changes in U.S. immigration policy. Negative effects on remittances could harm its economy, current account and its currency. During the last round of tariffs, some EM economies benefitted from nearshoring and the relocation of supply chains. As such, a selective, research-based investment approach, analyzing the impact as it is announced, is warranted in 2025.
In local emerging markets, valuations remain attractive, as many central banks have erred on the hawkish side given internal price pressures and external uncertainty. This means that real rates remain elevated in many EM countries, giving some central banks room to ease policy to support growth if needed as long as inflation remains under control. Uncertainty around fiscal policy (and some political issues) have led a significant repricing in some local markets, especially in Brazil and Mexico, where we see opportunities. Meanwhile, in South Africa, real rates are near historical highs and have room to decline. The primary risk in local emerging markets is higher U.S. interest rates due to looser fiscal policy, higher tariffs and a further economic growth driven by deregulation.
Fixed income markets remain attractive
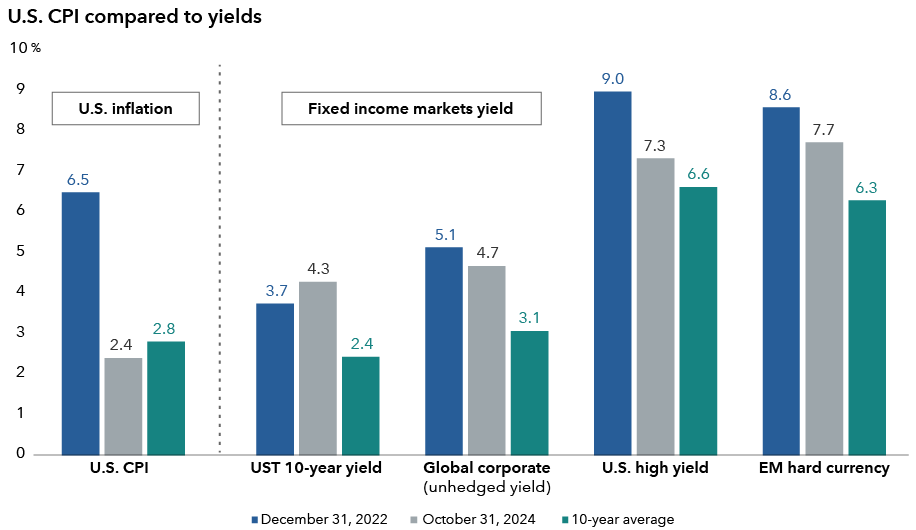
Source: Bloomberg. Index: 10-year U.S. Treasuries, Bloomberg Global Aggregate Corporate Index, Bloomberg U.S. High Yield 2% Issuer Cap Index and JPMorgan EMBI Global Diversified Index. U.S. CPI is based on the latest available print for September 2024. CPI: Consumer Price Index. UST: U.S. Treasury. Data as of September 30, 2024.
In hard currency sovereign markets, solid macro fundamentals but mixed valuations require greater selectivity. EM with lower external vulnerabilities and smaller internal imbalances offer greater market resilience and more flexibility for policymakers to address external risks. However, spreads are generally fairly tight in these economies whose sovereign bonds have higher credit ratings. Some countries, particularly frontier markets, benefit from IMF assistance and a lower vulnerability to U.S. trade policies. We see opportunities within Colombia and Honduras, despite political issues weighing on their outlooks. We also favor some corporates in Brazil, Mexico and India, which have taken a more prudent approach to borrowing than sovereigns, and they should also provide diversification.
Bottom line
Bonds appear to have returned to their traditional role as portfolio diversifiers. This dynamic was evident in early August 2024 when equity markets came under pressure on weaker-than-expected economic data. While equities sold off, bond markets rallied, mitigating losses for mixed asset portfolios. Over the past 50 years, the negative correlation between bonds and equities typically occurred when inflation was close to the Fed’s 2% target. Although there are exceptions (notably the 1990s), during periods of high inflation usually see both asset classes become positively correlated.
Past results are not predictive of results in future periods.
Bloomberg U.S. Aggregate Index represents the U.S. investment-grade fixed-rate bond market.
Bloomberg U.S. Corporate Investment Grade Index represents the universe of investment grade, publicly issued U.S. corporate and specified foreign debentures and secured notes that meet the specific maturity, liquidity and quality requirements.
Bloomberg U.S. High Yield 2% Issuer Capped Index covers the universe of fixed-rate, non-investment grade debt.
JP Morgan Government Bond Index (GBI) — Emerging Markets (EM) Global Diversified covers the universe of regularly traded, liquid fixed-rate, domestic currency emerging market government bonds to which international investors can gain exposure.
Duration is a measure of a bond or bond portfolio’s sensitivity to interest rates.
Don't miss our latest insights.
Our latest insights
-
-
Chart in Focus
-
Artificial Intelligence
-
Macro Brief
-
U.S. Equities
Don’t miss out
Get the Capital Ideas newsletter in your inbox every other week
 David Hoag
 Timothy Ng
 Damien McCann
 Kirstie Spence