Markets & Economy
Categories
Credit
5 factors to watch in multi-sector credit
 Damien McCann
 David Bradin
March 19, 2025
The current macroeconomic environment has created a supportive backdrop for multi-sector credit, with yields likely to remain elevated as inflation lingers above central bank targets. This market provides a good opportunity for credit investors to generate attractive returns by allocating strategically across a diversified mix of sectors.
Here are five factors we believe will support multi-sector portfolios in 2025:
1. Positive economic growth provides a strong backdrop for credit
Uncertainty around policy outcomes related to tariffs, tax, regulation and foreign relations are unusually high, but the data and information we have suggests we should continue to expect positive growth and slowly falling inflation. U.S. corporate earnings growth is projected to be 14.8% year-over-year.
Additionally, investment-grade (BBB/Baa and above) and high-yield issuer balance sheets are in good shape for this part of the economic cycle, creating strong fundamental support for the asset classes. Capital requirements for refinancing are low and the outlook for defaults remains subdued.
For high yield specifically, the impact of sticky but decelerating cost inflation may create an environment of lower revenue and earnings growth. But earnings remain positive, and the high coupons available in this market still look attractive. Importantly, high-yield issuers generally do not need significant earnings growth to service existing debt obligations or generate cash flow.
2. Volatility highlights the need for a flexible approach
Rate and spread volatility could be elevated in 2025, as markets price in shifting expectations around economic growth, political instability and potential Federal Reserve action. Spreads to Treasuries and interest rates should remain range-bound, with yields on 10-year Treasuries hovering between 4% and 5% and spreads staying near the tight end of historical valuations. Still, there could be opportunities within those ranges by rotating across credit sectors, especially if spread volatility increases and high-yield bonds underperform higher quality investment-grade (IG) assets.
Uncertainty around Federal Reserve decisions and monetary policy changes could trigger volatility and create opportunities within more rate-sensitive sectors like IG, which has more than double the duration of high yield.
Rate sensitivity varies widely among credit sectors
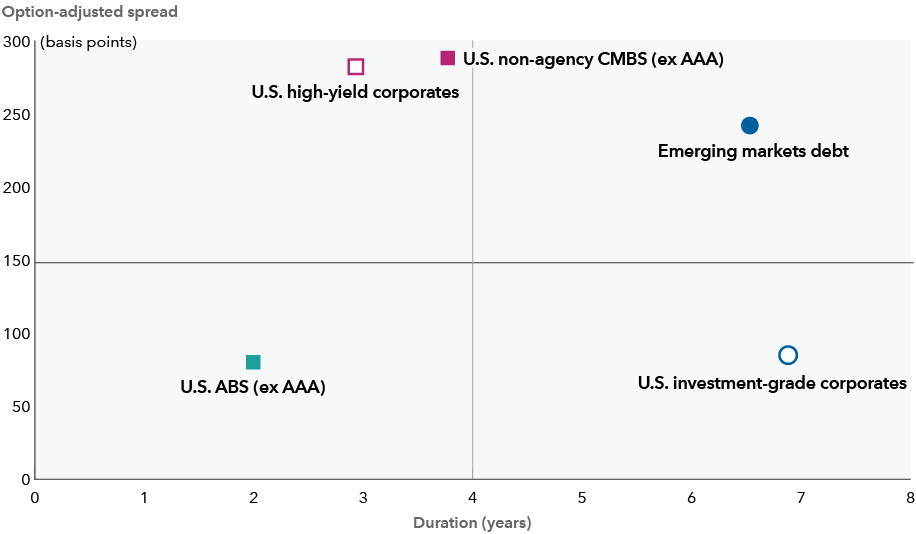
Source: Bloomberg. Data as of February 28, 2025. Chart shows average duration and option-adjusted spread for the Bloomberg U.S. High Yield 2% Issuer Capped Index, Bloomberg U.S. Corporate Investment Grade Index, J.P. Morgan Emerging Market Bond Global Diversified Index, Bloomberg U.S. CMBS non-agency ex AAA Index and Bloomberg US ABS ex AAA Index.
3. Credit selector’s market
Credit spreads have broadly recovered from the wide levels of the last several years, and some sectors are at or near their tightest level in recent history. Critically, credit markets are fragmented and diverse, meaning there is no measure of valuations that can describe the entire market as “rich” or “cheap.” By shifting allocations when opportunities arise, investors in multi-sector income strategies can seek to capture value in credit markets wherever it exists.
Thematically, in applicable multi-sector income portfolios, we are looking to allocate to issuers in industries where there are potential catalysts for spread tightening. These include cost reductions, debt paydown, underlying asset valuation recovery, event risk mitigation and improved refinancing opportunities. For example, in commercial real estate, we see a continued recovery in underlying asset value, driven by an easier financing environment and improving occupancy.
When spreads are largely narrow, issuer selection is key. In certain sectors, including pharmaceuticals, utilities, managed health care, energy and commercial real estate, fundamental analysis reveals opportunities where individual names trade at wider spreads than the broader market, and/or wide of fair value. Within the pharmaceutical sector we see numerous opportunities. Some issuers are paying down debt and are likely to be upgraded by rating agencies. In other sectors, we expect spreads to tighten where companies have successfully offset the risk of patent expirations by launching new products.
Compressed spreads highlight importance of security selection
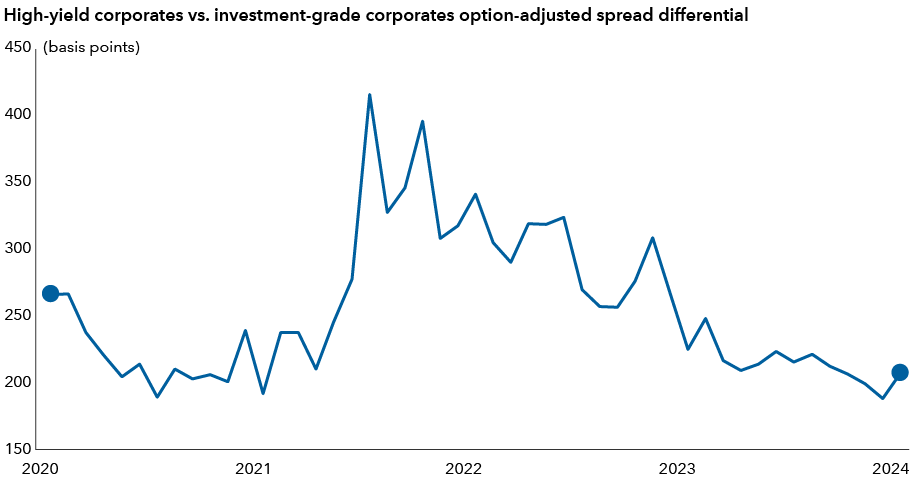
Source: Bloomberg. Data as of 12/31/2024. Chart shows the difference in option-adjusted spreads (OAS) for the Bloomberg U.S. Corporate Investment Grade Index and Bloomberg U.S. Corporate High Yield – 2% Issuer Capped Index.
4. An increase in M&A-related issuance may provide opportunities
We expect a friendlier regulatory environment from the new U.S. administration, which may lead to an increase in mergers and acquisitions (M&A). This should present opportunities. M&A-related bonds are typically issued at a premium to existing bonds in the market and often tighten over time as synergies are realized and companies pay down debt.
This trend has been observed over the past several years, especially in the pharmaceutical sector, where companies have frequently issued debt to fund acquisitions. Over time, higher cash flows have allowed these issuers to pay down their debts, which has been a catalyst for spread tightening.
We expect M&A to increase in areas of the health care sector. Some senior executives have signaled they expect increased deal volume in 2025. The growing number of mature companies sitting in the private equity market could also contribute to increased M&A activity across sectors. Valuations, M&A track records and engagement with sellers will be key indicators of where we may find opportunities and value.
M&A-related issuance set to continue climbing
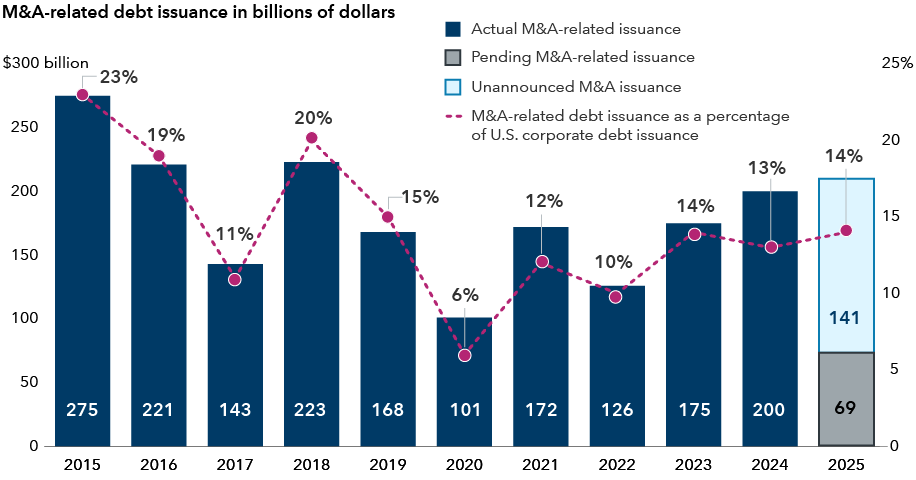
Source: J.P. Morgan. Data as of December 31, 2024. The 2025 data is a forecast.
5. Securitized valuations remain compelling
Securitized credit remains attractive on both an absolute and relative basis. Spreads across several areas remain wide as concerns around both consumer and commercial real estate weigh on the sector. But we are being opportunistic. Our asset-backed securities (ABS) and commercial mortgage-backed securities (CMBS) analysts believe these worries are ‘throwing the baby out with the bath water.’ Our analysts have identified opportunities to invest in select well-capitalized securitized tranches, where they expect valuations will revert to historical norms compared to IG corporates.
For instance, we are selectively finding value in office properties, including single-asset single-borrower (SASB) deals as well as conduit CMBS, as return-to-office mandates boost occupancy and the refinancing environment improves. AA and single A rated tranches are well-capitalized and offer credit spreads well above comparable IG corporate credit.
Learn more about
Duration – A measure of a bond’s sensitivity to changes in interest rates. Generally speaking, a bond's price will go up 1% for every year of duration if interest rates fall by 1% or down 1% for every year of duration if interest rates rise by 1%.
Option-adjusted spread – The measurement of the spread of a fixed income security rate and the risk-free rate of return, which is adjusted to take into account an embedded option.
Bloomberg U.S. Corporate Investment Grade Index represents the universe of investment grade, publicly issued U.S. corporate and specified foreign debentures and secured notes that meet the specified maturity, liquidity, and quality requirements. This index is unmanaged, and its results include reinvested distributions but do not reflect the effect of sales charges, commissions, account fees, expenses or U.S. federal income taxes.
Bloomberg U.S. Corporate High Yield 2% Issuer Capped Index covers the universe of fixed-rate, non-investment-grade debt. The index limits the maximum exposure of any one issuer to 2%. This index is unmanaged, and its results include reinvested distributions but do not reflect the effect of sales charges, commissions, account fees, expenses or U.S. federal income taxes.
Bloomberg U.S. Mortgage Backed Securities (MBS) ex-AAA Index is a market-value-weighted index that covers the mortgage-backed pass-through securities of Ginnie Mae (GNMA), Fannie Mae (FNMA), and Freddie Mac (FHLMC) excluding securities rated AAA.
Bloomberg Asset Backed Securities (ABS) ex AAA Index represents the universe of U.S. asset-backed securities excluding securities rated AAA.
Don't miss our latest insights.
Our latest insights
-
-
-
Market Volatility
-
Market Volatility
-
World Markets Review
Don’t miss out
Get the Capital Ideas newsletter in your inbox every other week
Investments are not FDIC-insured, nor are they deposits of or guaranteed by a bank or any other entity, so they may lose value.
Investors should carefully consider investment objectives, risks, charges and expenses.
This and other important information is contained in the prospectuses and summary prospectuses, which can be obtained from a financial professional and should be read carefully before investing.
Bond ratings, which typically range from AAA/Aaa (highest) to D (lowest), are assigned by credit rating agencies such as Standard & Poor's, Moody's and/or Fitch, as an indication of an issuer's creditworthiness.
The value of fixed income securities may be affected by changing interest rates and changes in credit ratings of the securities.
The return of principal for bond portfolios and for portfolios with significant underlying bond holdings is not guaranteed. Investments are subject to the same interest rate, inflation and credit risks associated with the underlying bond holdings.
Lower rated bonds are subject to greater fluctuations in value and risk of loss of income and principal than higher rated bonds.
There have been periods when the results lagged the index(es) and/or average(s).
The indexes are unmanaged and, therefore, have no expenses. Investors cannot invest directly in an index.
This report, and any product, index or fund referred to herein, is not sponsored, endorsed or promoted in any way by J.P. Morgan or any of its affiliates who provide no warranties whatsoever, express or implied, and shall have no liability to any prospective investor, in connection with this report. J.P. Morgan disclaimer: https://www.jpmm.com/research/disclosures
Source: Bloomberg Index Services Limited. BLOOMBERG® is a trademark and service mark of Bloomberg Finance L.P. and its affiliates (collectively "Bloomberg"). Bloomberg or Bloomberg's licensors own all proprietary rights in the Bloomberg Indices. Neither Bloomberg nor Bloomberg's licensors approves or endorses this material, or guarantees the accuracy or completeness of any information herein, or makes any warranty, express or implied, as to the results to be obtained therefrom and, to the maximum extent allowed by law, neither shall have any liability or responsibility for injury or damages arising in connection therewith.
Statements attributed to an individual represent the opinions of that individual as of the date published and do not necessarily reflect the opinions of Capital Group or its affiliates. This information is intended to highlight issues and should not be considered advice, an endorsement or a recommendation.
All Capital Group trademarks mentioned are owned by The Capital Group Companies, Inc., an affiliated company or fund. All other company and product names mentioned are the property of their respective companies.
Use of this website is intended for U.S. residents only.
Capital Client Group, Inc.
This content, developed by Capital Group, home of American Funds, should not be used as a primary basis for investment decisions and is not intended to serve as impartial investment or fiduciary advice.