Categories
Target Date
Variability of target date results fuels litigation push
Rich Lang
Multi-Asset Investment Director
Polina Tsybrovska
Multi-Asset Product Manager
Kia Haseli
Multi-Asset Product Specialist
KEY TAKEAWAYS
  • Recent lawsuits indicate a shift from a focus on fees to results and, ultimately, participant outcomes
  • Differences in returns continue to meaningfully surpass differences in fees, so a balanced approach to comparing both is prudent
  • Fiduciaries should consider ways to monitor and measure long-term consistency

Themes in ERISA* litigation continue to shift away from fees to a focus on results. Last year, cases were brought against a prominent passive provider. This year, a large active provider is in legal jeopardy after allegations of chronic underperformance. While none of these cases have yet proved their merit by moving past the motion to dismiss, the spotlight on results gives plan fiduciaries a strong reason to consider their target date fund (TDF) selection and monitoring processes.


Fundamentally, the question must be asked: Should a decision as important as selecting a TDF provider, with which a participant could be invested for 70 years or more, really be primarily focused on costs? Or is a more comprehensive view needed, one that considers fees, outcomes, and the ability to smooth market volatility? Indeed, looking at the last 10 years of history, the variability of results in the TDF industry is more than three times the difference in fees. 


Dispersion of target date fund returns far outpaced difference in fees
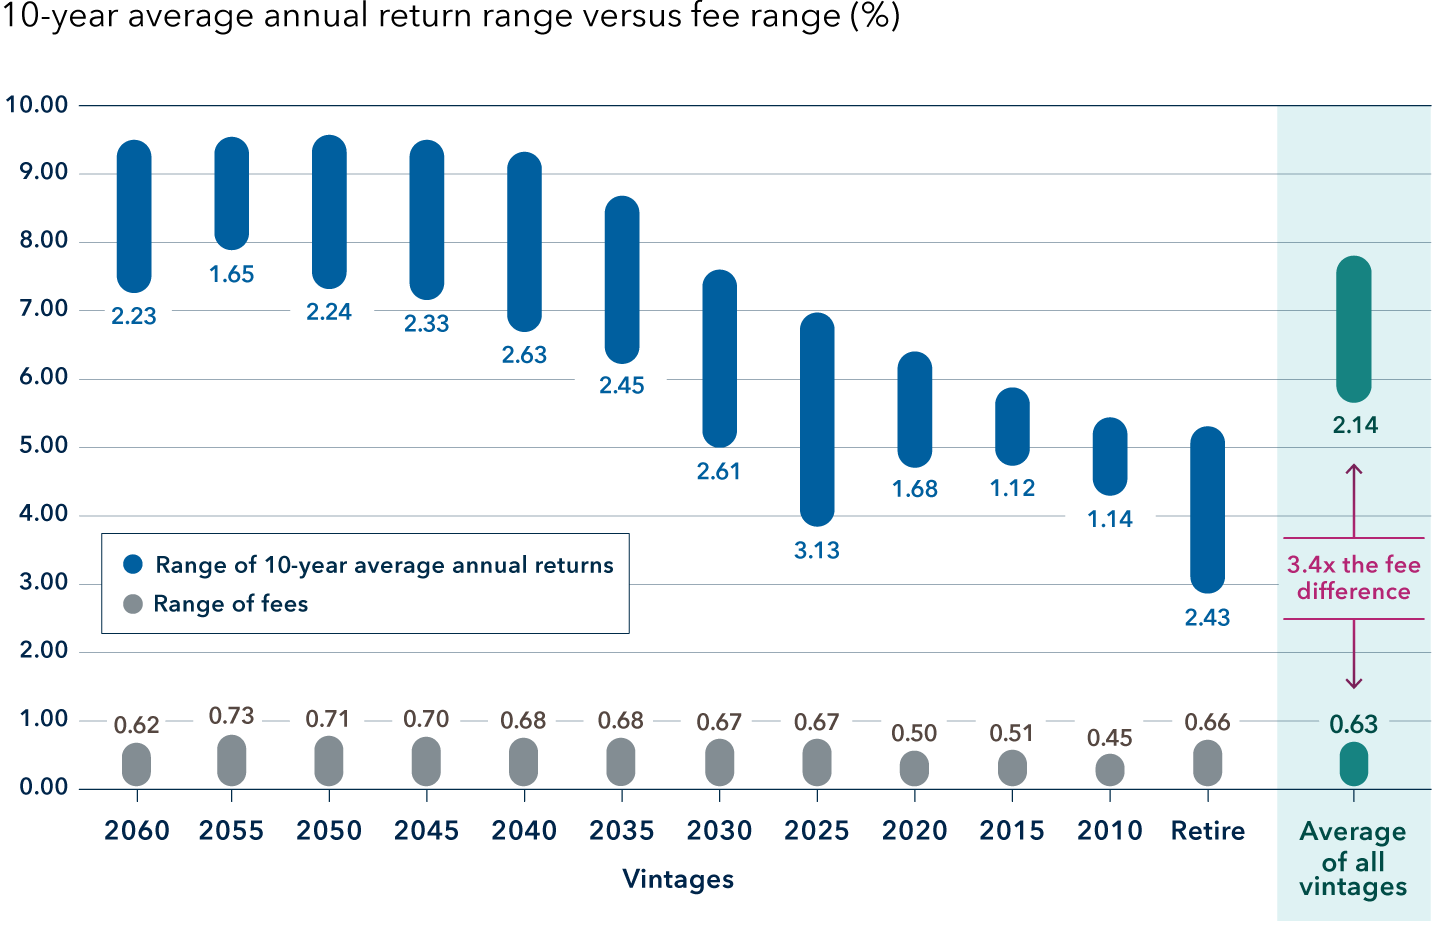
This chart compares the range of 10-year average annual returns (represented by oval blue bars) with the range of fees (represented by oval gray bars) for 12 target date vintages. It also provides the average for each range (represented by oval green bars). The 2055 vintage has a 10-year average annual return range of 1.60% (minimum return: 7.90%; maximum return: 9.50%) and a fee range of 0.72% (minimum fee: 0.06%; maximum fee 0.78%). The 2050 vintage has a 10-year average annual return range of 2.57% (minimum return: 6.98%; maximum return: 9.55%) and a fee range of 0.70% (minimum fee: 0.06%; maximum fee 0.76%). The 2045 vintage has a 10-year average annual return range of 1.95% (minimum return: 7.57%; maximum return: 9.52%) and a fee range of 0.69% (minimum fee: 0.06%; maximum fee 0.75%). The 2040 vintage has a 10-year average annual return range of 2.88% (minimum return: 6.51%; maximum return: 9.39%) and a fee range of 0.68% (minimum fee: 0.06%; maximum fee 0.74%). The 2035 vintage has a 10-year average annual return range of 2.51% (minimum return: 6.46%; maximum return: 8.97%) and a fee range of 0.67% (minimum fee: 0.06%; maximum fee 0.73%). The 2030 vintage has a 10-year average annual return range of 2.74% (minimum return: 5.36%; maximum return: 8.1%) and a fee range of 0.66% (minimum fee: 0.06%; maximum fee 0.72%). The 2025 vintage has a 10-year average annual return range of 3.19% (minimum return: 4.18%; maximum return: 7.37%) and a fee range of 0.66% (minimum fee: 0.06%; maximum fee 0.72%). The 2020 vintage has a 10-year average annual return range of 1.7% (minimum return: 5%; maximum return: 6.7%) and a fee range of 0.56% (minimum fee: 0.06%; maximum fee 0.62%). The 2015 vintage has a 10-year average annual return range of 1.39% (minimum return: 4.64%; maximum return: 6.03%) and a fee range of 0.48% (minimum fee: 0.06%; maximum fee 0.54%). The 2010 vintage has a 10-year average annual return range of 0.88% (minimum return: 4.53%; maximum return: 5.41%) and a fee range of 0.45% (minimum fee: 0.06%; maximum fee 0.51%). The 2005 vintage has a 10-year average annual return range of 1.20% (minimum return: 3.75%; maximum return: 4.95%) and a fee range of 0.43% (minimum fee: 0.06%; maximum fee 0.49%). The in-retirement vintage has a 10-year average annual return range of 2.62% (minimum return: 2.48%; maximum return: 5.1%) and a fee range of 0.62% (minimum fee: 0.06%; maximum fee 0.68%). The average vintage has a 10-year average annual return range of 2.10% (minimum return: 5.45%; maximum return: 7.55%) and a fee range of 0.61% (minimum fee: 0.06%; maximum fee 0.67%). Callout text with up and down arrows between the average ranges specifies that the average for the 10-year average annual return range is 3.4 times the fee range average.

Source: Capital Group, using data obtained from Morningstar as of June 30, 2023. Data shown is of the lowest-cost mutual fund share classes with a sufficient track record for each peer target date series. Represents 29 mutual fund target date series, excluding managed payout funds and target date series that are only available in wrap accounts or launched after July 1, 2013.

This isn’t a random selection process, with superior results that can be dismissed as mere luck, as history shows some providers have demonstrated a persistence of returns. Although past results are not necessarily indicative of future returns, considering long-term metrics can provide a lens into a target date provider’s historic consistency. In return, this can help fiduciaries establish a process for choosing which TDF provider seems most likely to help participants achieve their retirement goals. With that in mind, consider risk-adjusted returns, which incorporate both returns and volatility. Consistently high Sharpe ratios versus peers can help indicate the value in an investments’ returns given the level of risk.


In the paper linked below, we take a closer look at the long-term consistency in the American Funds Target Date Retirement Series® in terms of both return and risk, illustrating how it seeks to drive better outcomes for participants.


You must be logged in to download the PDF.


Rich Lang is a multi-asset investment director at Capital Group. He has 30 years of investment experience (as of 12/31/2023), all with Capital. He holds master's and bachelor's degrees from Loyola Marymount University.

Polina Tsybrovska is a multi-asset product manager with 13 years of experience (as of 12/31/2023). She holds a bachelor’s degree in finance from the University of Illinois at Chicago.

Kia Haseli is a multi-asset product specialist with six years of experience (as of 12/31/2022). He holds a bachelor’s degree in economics and business management from the University of California, Merced.


*The Employee Retirement Income Security Act (ERISA) is a federal law enacted in 1974 that protects the retirement assets of American workers, implementing rules that qualified plans must adhere to and ensure that plan fiduciaries do not misuse plan assets.

Sharpe ratio uses standard deviation (a measure of volatility) and returns to determine the reward per unit of risk. The higher the ratio, the better the portfolio’s historical risk-adjusted performance.

Don’t miss out

Get the Capital Ideas newsletter in your inbox every other week

Investments are not FDIC-insured, nor are they deposits of or guaranteed by a bank or any other entity, so they may lose value.
Investors should carefully consider investment objectives, risks, charges and expenses. This and other important information is contained in the fund prospectuses and summary prospectuses, which can be obtained from a financial professional and should be read carefully before investing.
Although the target date portfolios are managed for investors on a projected retirement date time frame, the allocation strategy does not guarantee that investors' retirement goals will be met. Investment professionals manage the portfolio, moving it from a more growth-oriented strategy to a more income-oriented focus as the target date gets closer. The target date is the year that corresponds roughly to the year in which an investor is assumed to retire and begin taking withdrawals. Investment professionals continue to manage each portfolio for approximately 30 years after it reaches its target date.
Statements attributed to an individual represent the opinions of that individual as of the date published and do not necessarily reflect the opinions of Capital Group or its affiliates. This information is intended to highlight issues and should not be considered advice, an endorsement or a recommendation.
All Capital Group trademarks mentioned are owned by The Capital Group Companies, Inc., an affiliated company or fund. All other company and product names mentioned are the property of their respective companies.
Use of this website is intended for U.S. residents only.
The Morningstar average expense ratios are based on fund statistics for each fund's prospectus available at the time of publication. The expense ratio is one aspect of plan fees and expenses.
Capital Client Group, Inc.
This content, developed by Capital Group, home of American Funds, should not be used as a primary basis for investment decisions and is not intended to serve as impartial investment or fiduciary advice.