Artificial Intelligence
Categories
Macro Brief
Private sector boost: 3 charts on U.S. growth
 Darrell Spence
March 18, 2025
It is sometimes assumed that government spending has been the primary driver of U.S. gross domestic product (GDP) growth, especially in the wake of the COVID-19 pandemic and ensuing economic recovery. While government spending can offer a short-term boost at times, household and business sector activity more frequently have a larger impact on the economy.
Private final demand (the combination of consumer spending plus business investment) has increased by 3.1% over the past year, compared to 2.7% for overall GDP, and is currently providing the largest contribution to U.S. GDP growth. Despite concerns regarding tariff policy, domestic investment is advancing in areas such as artificial intelligence (AI) data centers and pharmaceutical manufacturing facilities. In addition, U.S. consumers remain resilient. Both of these are factors that contribute to our view that U.S. GDP growth could be slightly above consensus this year.
The chart below shows the government’s and private sector’s contributions to GDP growth since the Inflation Reduction Act was signed into law in August 2022.
GDP gets a lift from the private sector
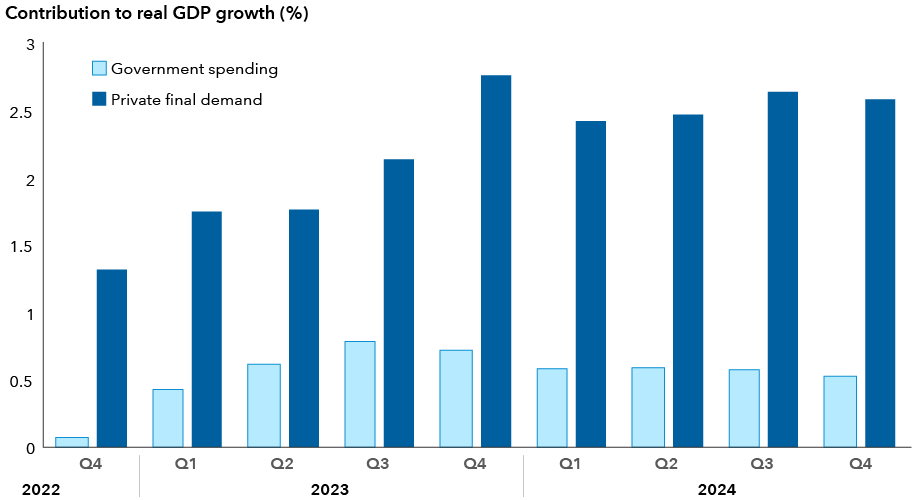
Sources: Capital Group, Macrobond. Data from the fourth quarter of 2022 to the fourth quarter of 2024.
That said, government spending clearly has multiplier effects and does find its way into the private sector. If government spending played an outsized role in the economy, however, one might expect to see divergences between consumer spending growth and/or business investment and the fundamentals that have historically driven them. However, that does not appear to be the case.
In fact, there are good reasons for healthy private sector activity. Real income growth (adjusted for inflation) is approaching 4.0% per annum, suggesting a solid foundation for consumer spending, as the two tend to move together. Consumer spending alone comprises about 70% of U.S. GDP, and is heavily influenced by job growth and wages, both of which remain healthy.
U.S. consumers remain in a position of strength
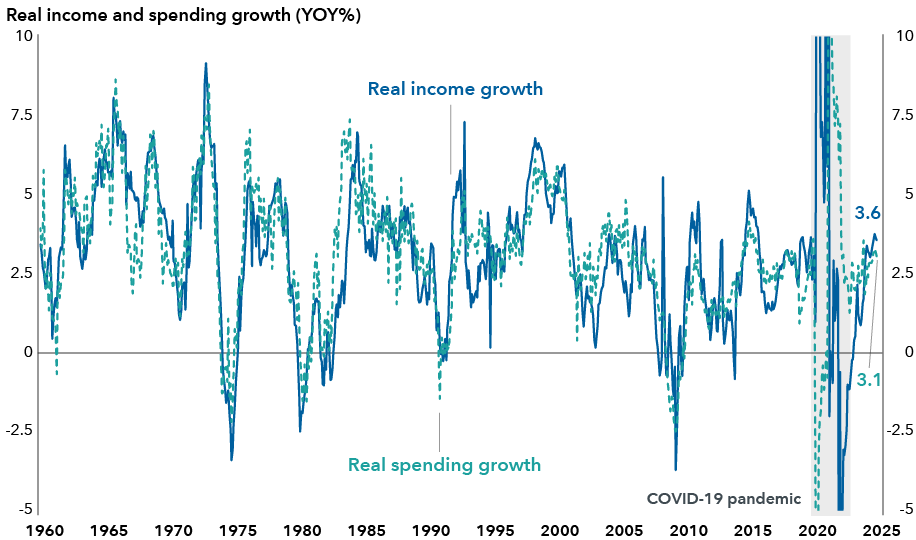
Sources: Capital Group, Macrobond. Data from January 1, 1960, to December 1, 2024.
At the same time, profit growth is improving and capacity utilization stabilizing, supporting a modest pickup in business investment. Granted, artificial intelligence (AI) has been a remarkable driver of domestic investment, and questions remain around the extent to which technology firms will continue to invest at current levels. However, it is important to note that non-tech investment is still a large share of U.S. investment.
The fact that both consumer spending and business investment are tracking the fundamentals that have historically supported them suggests that private demand is supporting growth more than government spending and is encouraging for the sustainability of overall economic growth.
Profits are growing and businesses are investing
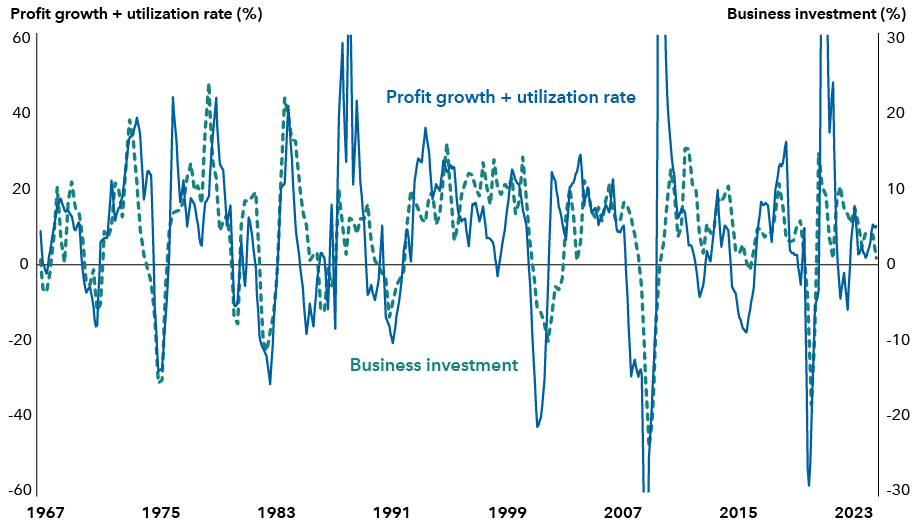
Sources: Bureau of Economic Analysis, S&P Global Ratings and U.S. Federal Reserve. Business profit growth and capacity utilization rate is represented by the S&P 500 Index operating earnings per share growth rate and capacity utilization rate. Data from 1967 to December 2024.
Still, it should be acknowledged that the most recent monthly retail sales number came in below expectations, which has created some concern about the U.S. consumer weakening. However, as we say, “one month’s data does not make a new trend,” which could be especially true when that month was the coldest in nearly four years.
That said, it is also true that a new trend always starts with one month’s data. However, in my opinion, it does not appear that we are at the beginning of a new, slower growth trend. Income generated by labor market conditions does not suggest a persistent slowdown in retail sales growth, and the share of companies with declining profits is well below levels historically consistent with job cuts.
As noted above, however, there is an increasing possibility that tariff policy or other geo-political developments could throw all of this off track, so we are monitoring those closely. Absent that, however, the bottom line is that consumer spending and business investment still seem well-supported by the fundamentals, which should reinforce private final demand as the primary driver of U.S. economic performance.
Learn more about
Real business investment: Inflation-adjusted business expenditure on physical assets, such as machinery, buildings, equipment and technology.
Utilization rate: A measure of the percentage of available time or resources used in production.
The S&P 500 Index is a market-capitalization-weighted index based on the results of approximately 500 widely held common stocks.
Don't miss our latest insights.
Our latest insights
-
-
Health Care
-
Market Volatility
-
Market Volatility
-
Chart in Focus
RELATED INSIGHTS
-
Artificial Intelligence
-
Market Volatility
-
Market Volatility
Don’t miss out
Get the Capital Ideas newsletter in your inbox every other week
Investments are not FDIC-insured, nor are they deposits of or guaranteed by a bank or any other entity, so they may lose value.
Investors should carefully consider investment objectives, risks, charges and expenses.
This and other important information is contained in the prospectuses and summary prospectuses, which can be obtained from a financial professional and should be read carefully before investing.
The indexes are unmanaged and, therefore, have no expenses. Investors cannot invest directly in an index.
Each S&P Index ("Index") shown is a product of S&P Dow Jones Indices LLC and/or its affiliates and has been licensed for use by Capital Group. Copyright © 2026 S&P Dow Jones Indices LLC, a division of S&P Global, and/or its affiliates. All rights reserved. Redistribution or reproduction in whole or in part is prohibited without written permission of S&P Dow Jones Indices LLC.
Statements attributed to an individual represent the opinions of that individual as of the date published and do not necessarily reflect the opinions of Capital Group or its affiliates. This information is intended to highlight issues and should not be considered advice, an endorsement or a recommendation.
All Capital Group trademarks mentioned are owned by The Capital Group Companies, Inc., an affiliated company or fund. All other company and product names mentioned are the property of their respective companies.
Use of this website is intended for U.S. residents only.
Capital Client Group, Inc.
This content, developed by Capital Group, home of American Funds, should not be used as a primary basis for investment decisions and is not intended to serve as impartial investment or fiduciary advice.