Municipal Bonds
Categories
Interest Rates
A framework for thinking about the path of interest rates
 Greg Garrett
January 31, 2025
U.S. Treasury yields have been elevated recently, causing many investors to wonder just how high they could go. Stronger economic data combined with the election of President Donald Trump have shifted investor expectations regarding economic growth. The potential for continued budget deficits is also raising concerns. Below, we hope to provide a framework or points of reference that will help guide investors when thinking about their allocations to fixed income in both the immediate and long term.
How high could interest rates go?
Historically, U.S. nominal gross domestic product (GDP) has been a reasonable guide for the upper limit on 10-year U.S. Treasury yields. While there have been periods where 10-year treasuries have traded above and below nominal GDP, the long-term trend in rates and nominal GDP has tended to be aligned. Periods where rates trade above nominal GDP, tend to be associated with recessions. There have also been extended periods when 10-year Treasury rates have traded below nominal GDP. For example, in the 1960s and 1970s, when inflation moved from 1% to above 10%. Another period was the decade after the 2008 global financial crisis (GFC), when the Federal Reserve engaged in quantitative easing (QE) and actively purchased long-term Treasury bonds.
Trump and the Republican Party’s success in securing control of both the Senate and the House of Representatives has raised the potential for more stimulative fiscal policy. This is driving our forecast for higher GDP growth and potential inflation. We forecast that GDP growth in 2025 is likely to be above 3.0%, absent any shocks, while core inflation is likely to be sticky between 2.5% and 3.5%. This puts the likely upward limit for U.S. 10-year Treasury bonds somewhere between 5.0% and 6.0%. While that is meaningfully higher than current levels around 4.4%, there are reasons to believe 10-year Treasury rates may not reach those levels. Higher interest rates in the U.S. have been met with demand from domestic institutions, such as pension funds and insurance companies that are hedging long-term liabilities. In addition, if long-term rates were to move significantly higher, it is possible the Federal Reserve could restart quantitative easing, although the circumstances would likely need to be somewhat extreme for that to happen. Suffice to say, that while nominal GDP may be a ceiling, there are reasons demand could keep 10-year U.S. Treasury yields from ever reaching that level.
Will U.S. GDP guide the 10-year U.S. Treasury yield?
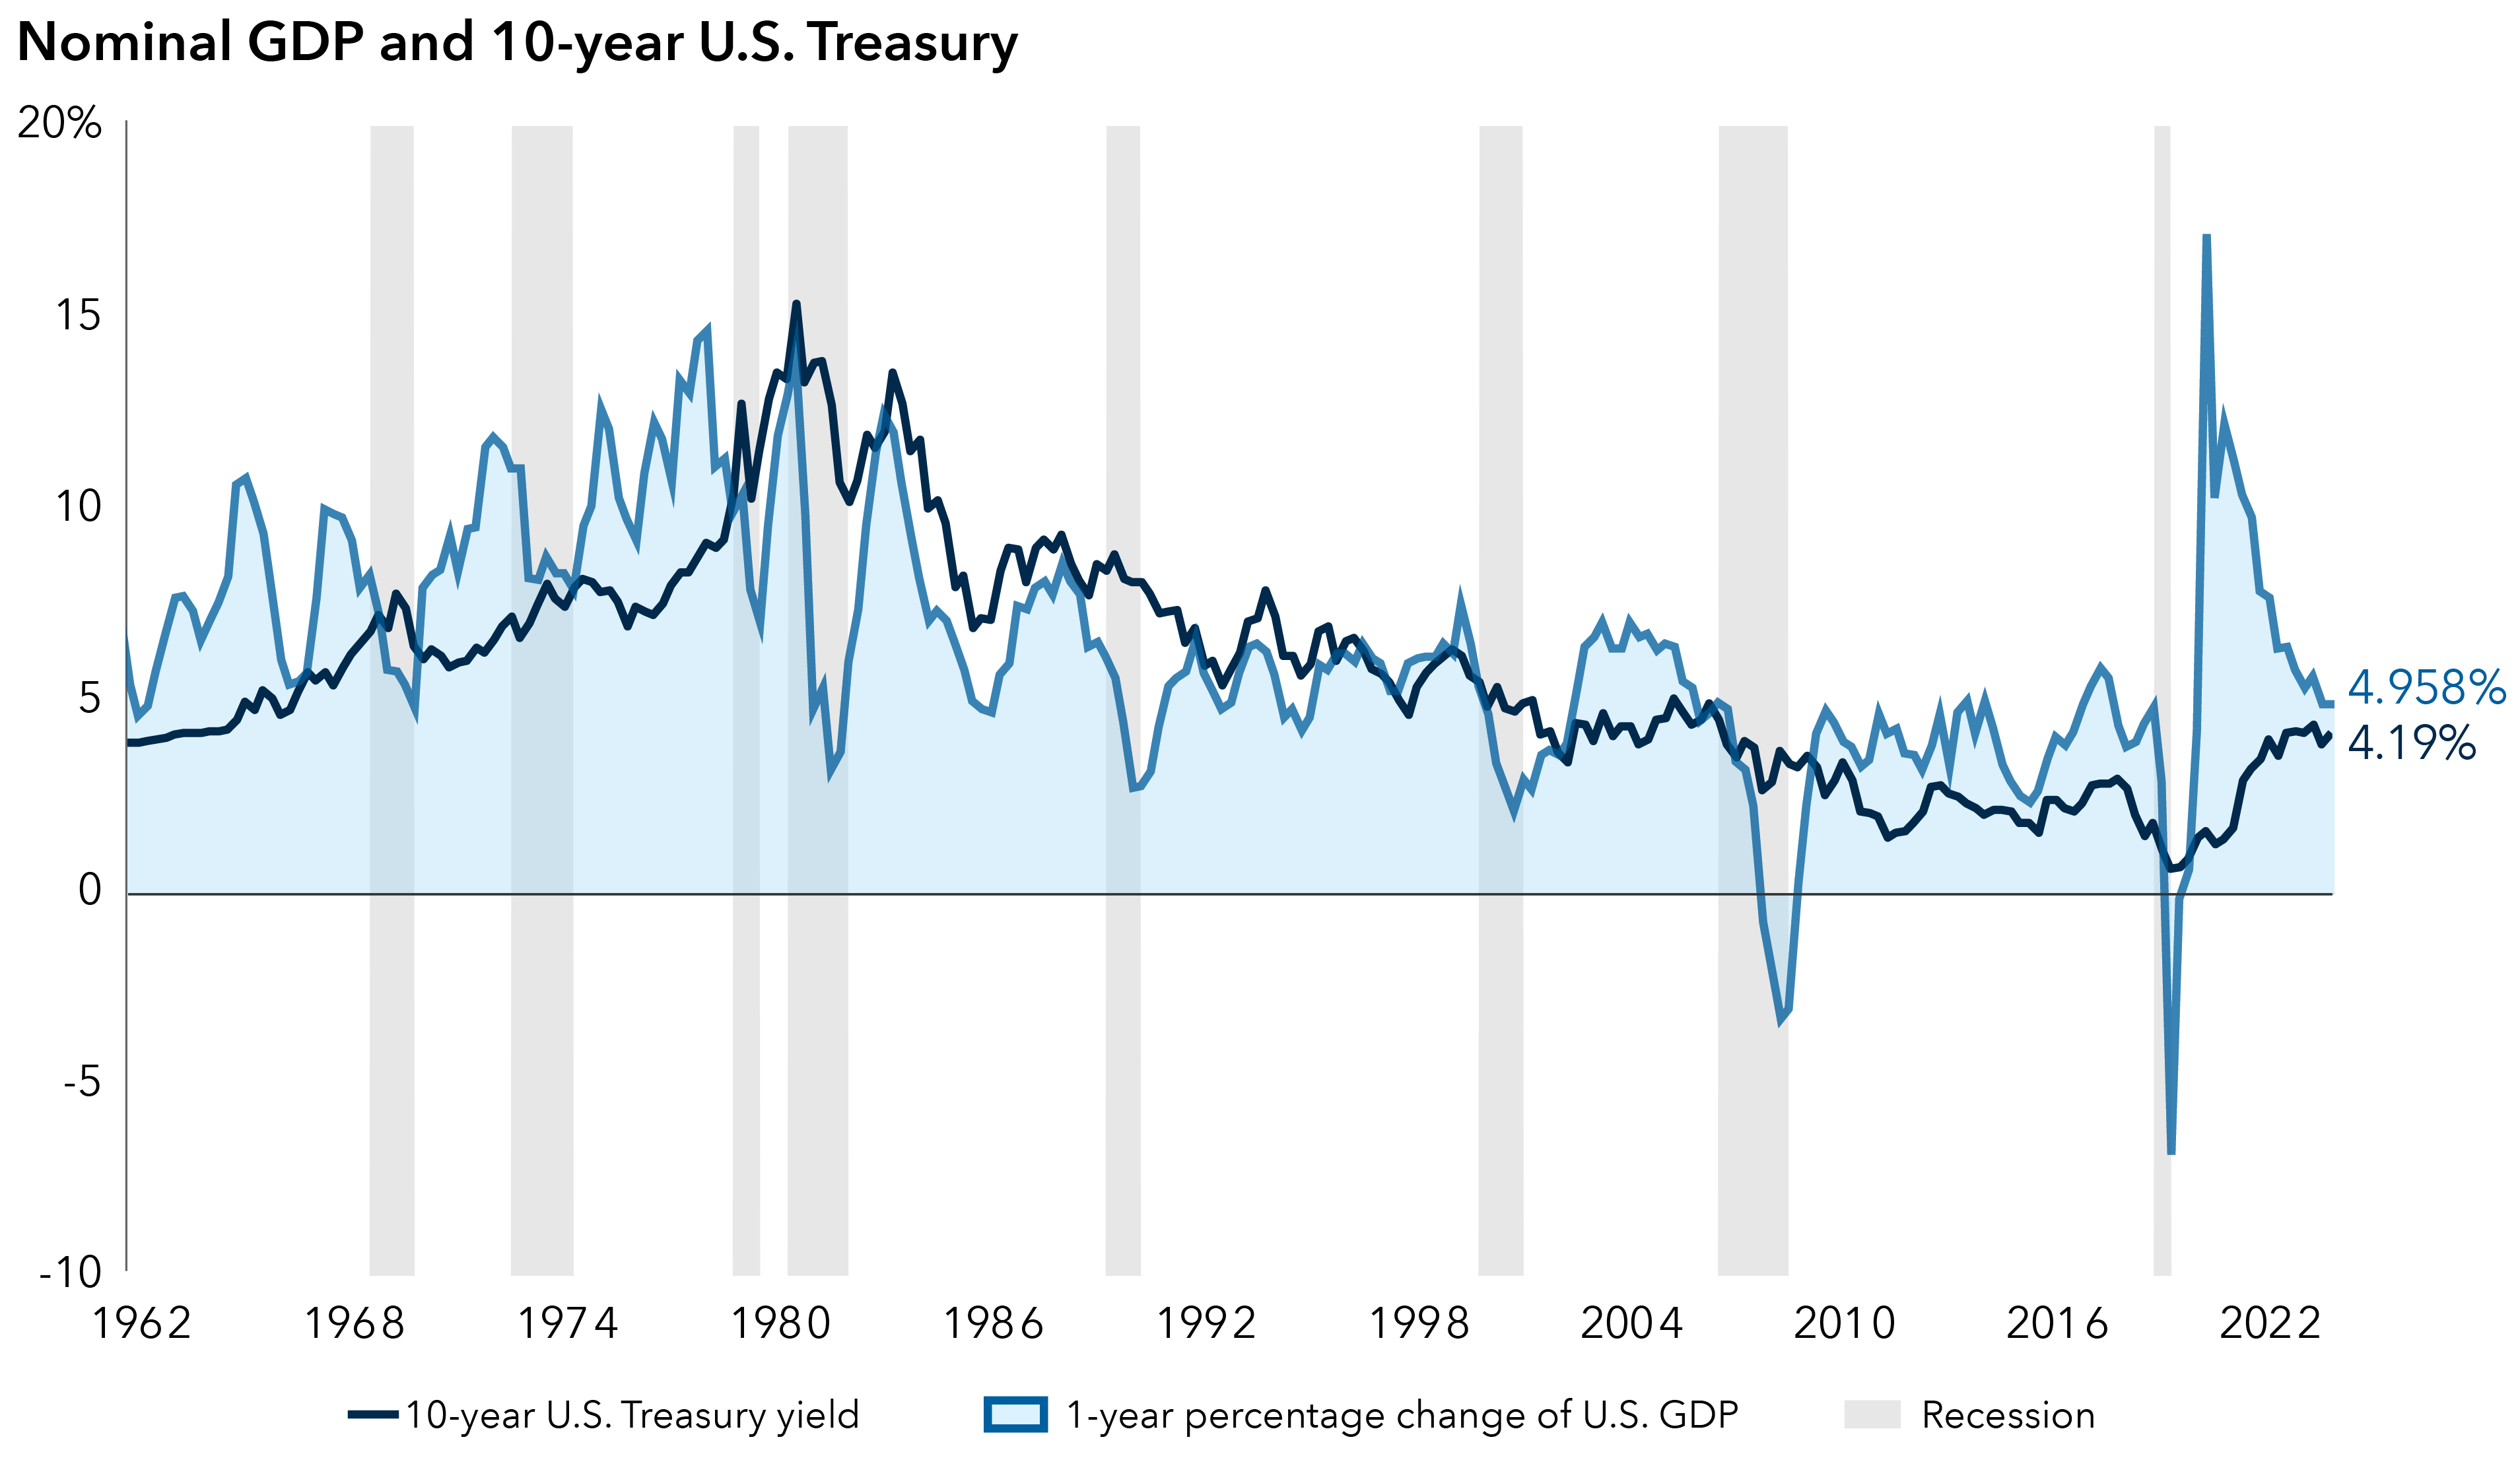
Source: LSEG Datastream. Data as of 12/31/2024. 10-year U.S Treasury yield constant maturity is quoted daily. Percentage change in GDP is calculated on an annualized basis.
Shorter term moves have tended to align with changes in economic data
The Citigroup Economic Surprise Index (CESI) tracks a broad array of economic indicators and compares their reported values to those of a median forecast. When the majority of data is being reported above expectations, the index registers a positive index value. When the majority of the data comes in below expectations, the index registers a negative value. CESI’s key is the strength of the data relative to the forecasted figures. Over time, two-month changes in 10-year Treasury yields have tended to track changes in the CESI. For example, the most recent move higher in the 10-year Treasury yield has shifted in concert with economic data that on balance has surprised on the upside. Like many relationships between economic indicators and markets, the correlation is far from perfect, but the change in the CESI can often mimic the directional moves in the 10-year U.S. Treasury yield. Thus, the change in economic momentum relative to forecasts appears to generally influence shorter term changes in the 10-year U.S. Treasury yields.
Economic indicators may signal where yields are headed
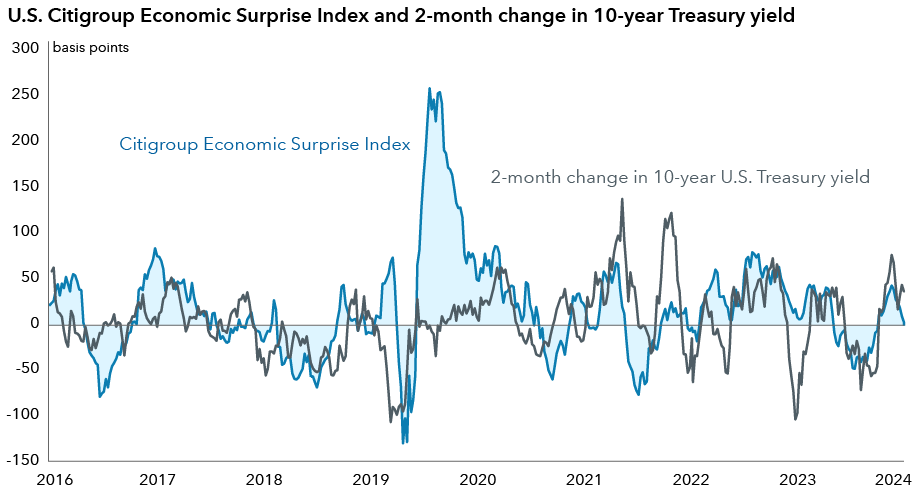
Source: LSEG Datastream. Data as of 12/31/2024.
Changes in the shape of the yield curve are driven by the economy and Federal Reserve policy
While investors will tend to focus on the 10-year Treasury yield as an indication of sentiment in the U.S. bond market, the shape of the yield curve is a more comprehensive measure of the outlook for interest rates and the economy. When the economy is in the early stages of an economic cycle and growth is accelerating, the yield curve is positively sloped, as stimulative short-term rates are lower than long-term interest rates. In this environment, investors want to be compensated for the potential of higher inflation over a longer period and also want to be compensated for the uncertainty of holding long-term bonds relative to holding shorter term bonds, which is known as the term premium. As the economic cycle matures and inflationary pressure builds, short-term interest rates move higher because investors anticipate changes in monetary policy and demand more compensation to hold short-term bonds. This action begins to flatten the yield curve as short-term rates move higher. Changes in short-term rates ultimately begin to reduce growth, the outlook for future growth dims and longer term interest rates begin to fall relative to short-term interest rates. This causes the yield curve to flatten or even invert if the expectation of growth decline is significant, which sets up the next cycle.
Federal Reserve policy tends to coincide with changes in the yield curve. At times the Fed has led the market, while at others it merely responds to action investors have already taken via their investment preferences along the yield curve. In the 10-year period after the GFC, the Federal Reserve was actively engaged in buying U.S. Treasury securities via quantitative easing. This led to some alteration in the relationship between the federal funds rate and the yield curve, but the broad trend and correlation remained in place. After one of the longest periods of inversion in the modern monetary era, the yield curve is now positively sloped because short-term interest rates have been reduced. Thus far, the inversion has yet to be followed by a recession, which is unusual. As a result, the interest rate declines may be less pronounced than in the past, leading to some steepening of the yield curve but perhaps not as much as the steepening of the last three cycles.
The yield curve may further steepen
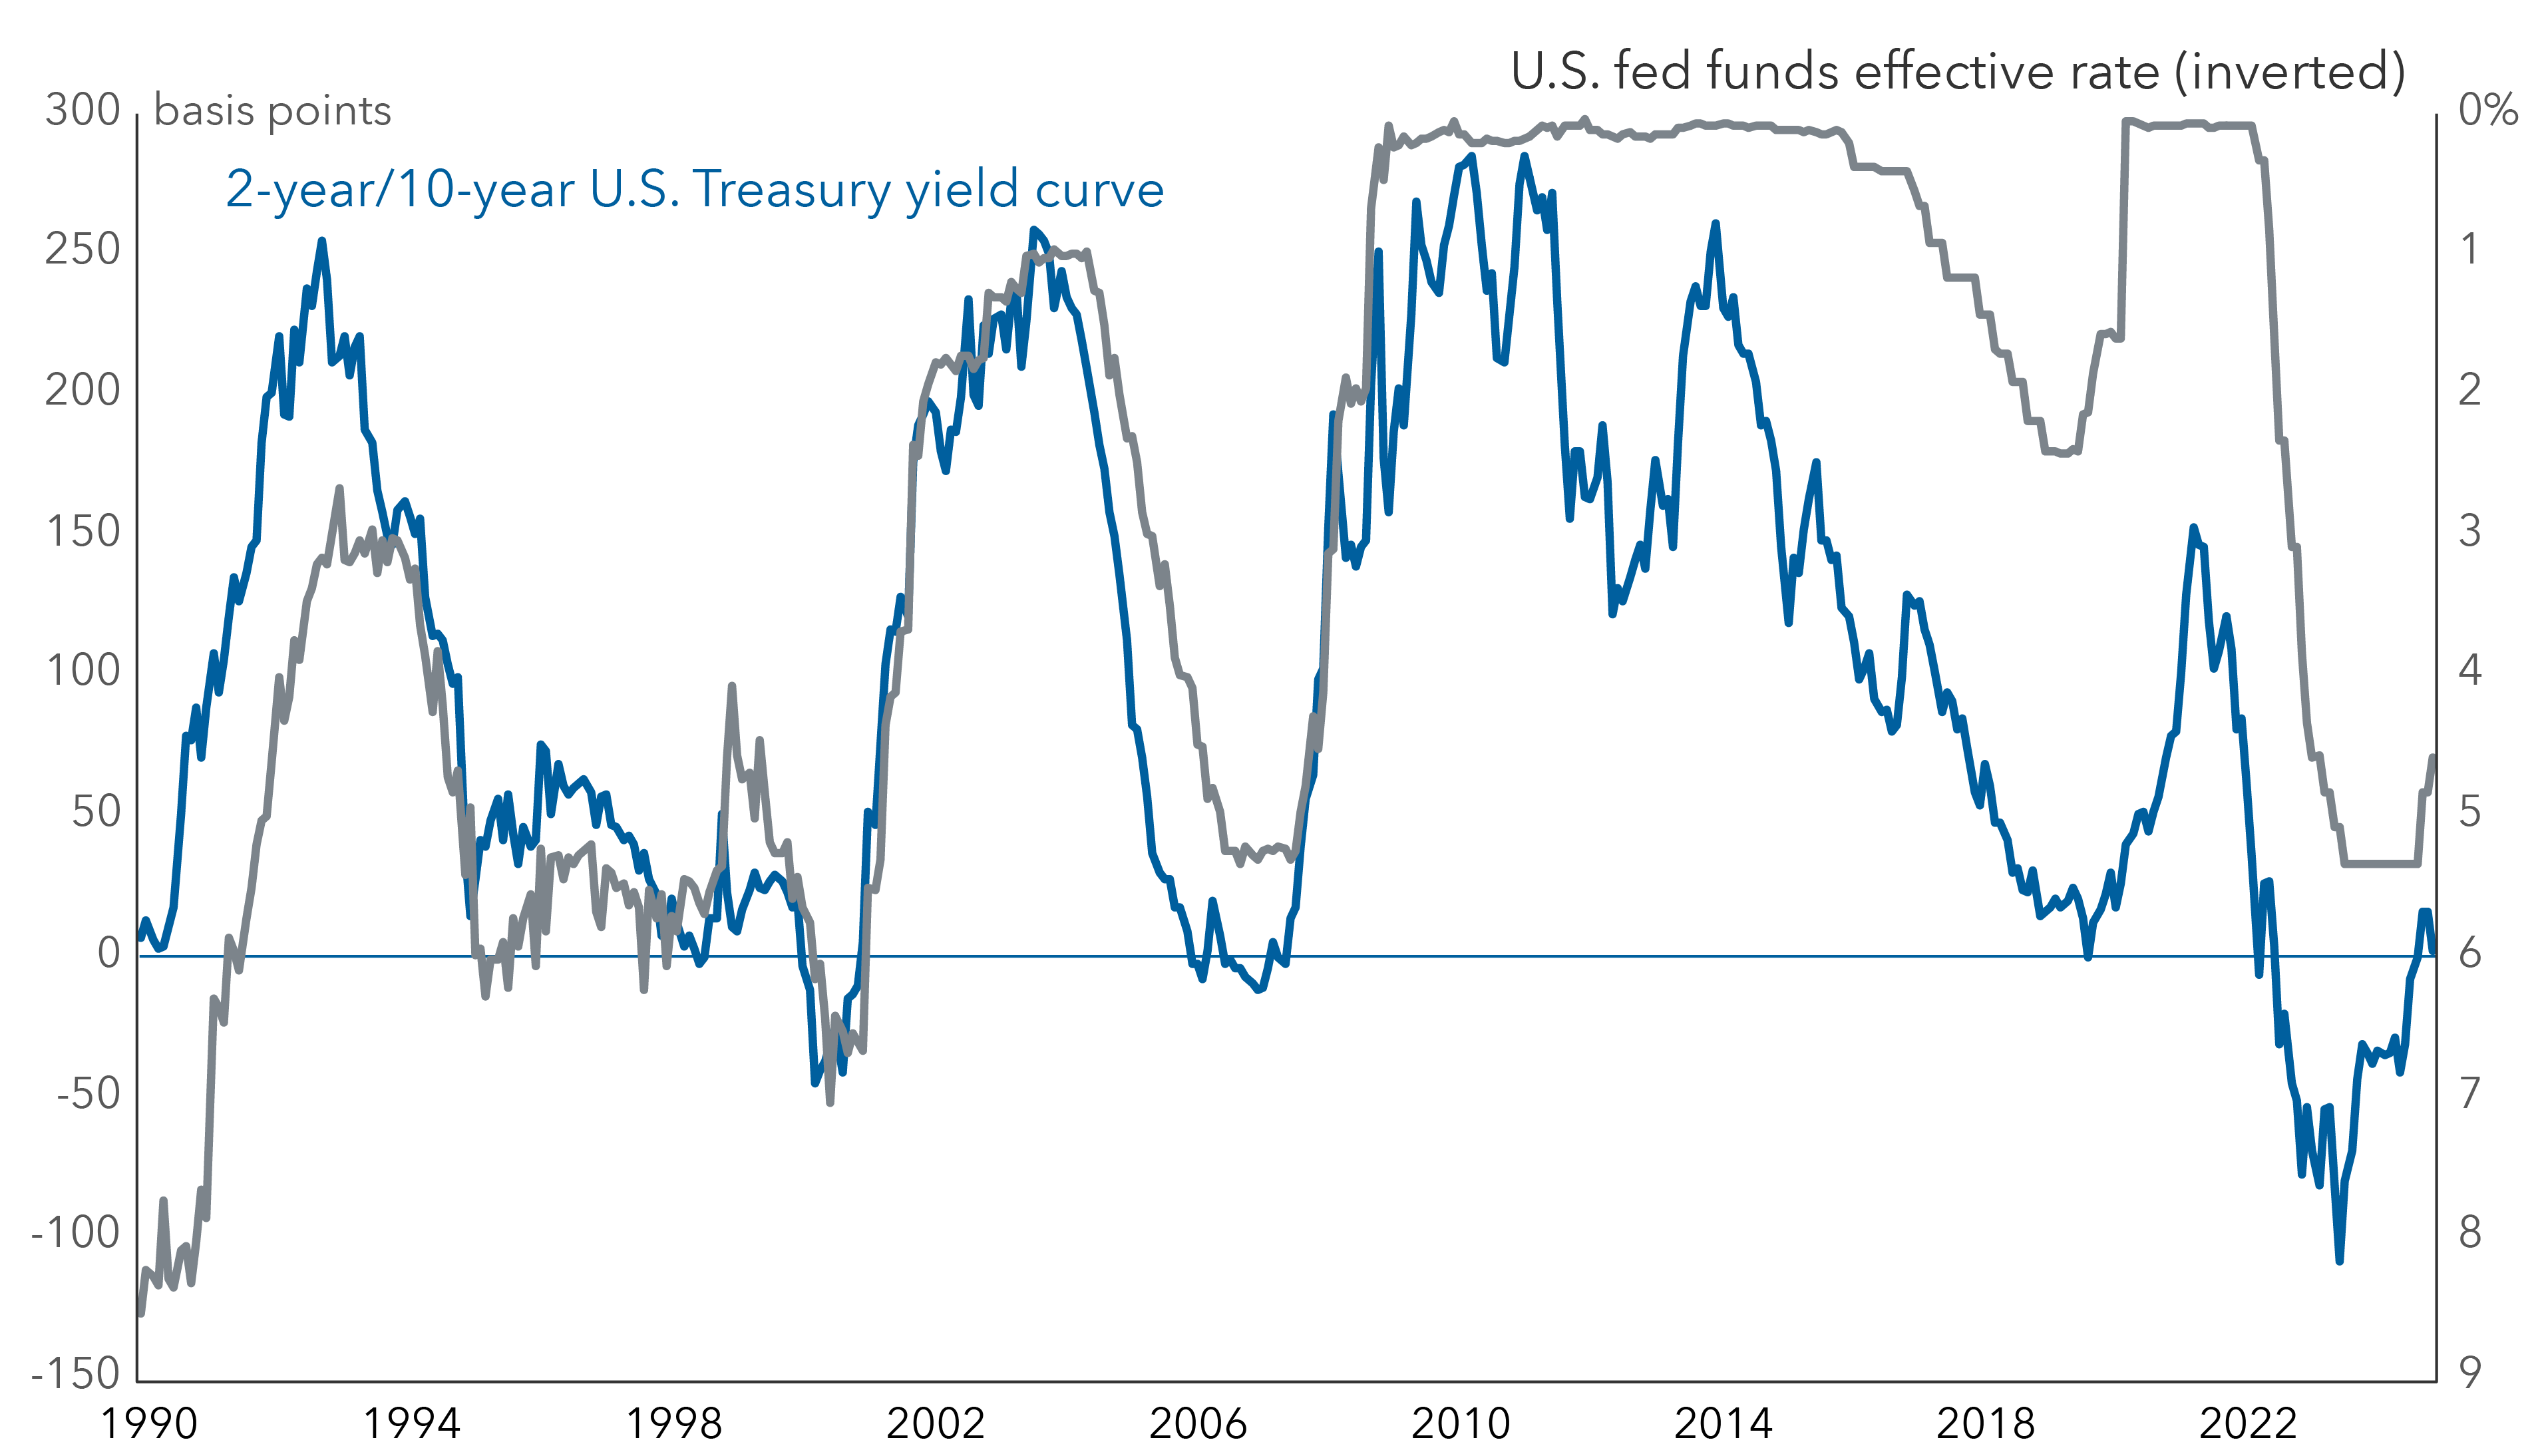
Source: LSEG Datastream. Data as of 12/31/2024.
Market expectations have shifted regarding rate cuts
Better economic data combined with anticipated pro-growth policies of the Trump administration pushed interest rates higher following the election and reduced the number of interest rate cuts priced in by investors. The market now anticipates the fed funds rate to be 3.75-4% by the end of 2025, which is 100 basis points above the level it was looking for at the time of the September Federal Open Market Committee (FOMC) meeting. The December FOMC meeting confirmed that the Federal Reserve is likely to take a more gradual approach to cutting interest rates, as the median dot plot forecast for the federal funds rate moved more in line with market expectations. This coincides with our belief that the inflation rate will gradually decline toward the Federal Reserve’s target of 2.0%, taking at least two more years to reach that level. The slower pace of rate cuts coincides with our view that the yield curve is likely to steepen at a gradual pace, as well.
The Fed has recalibrated rate-cut expectations
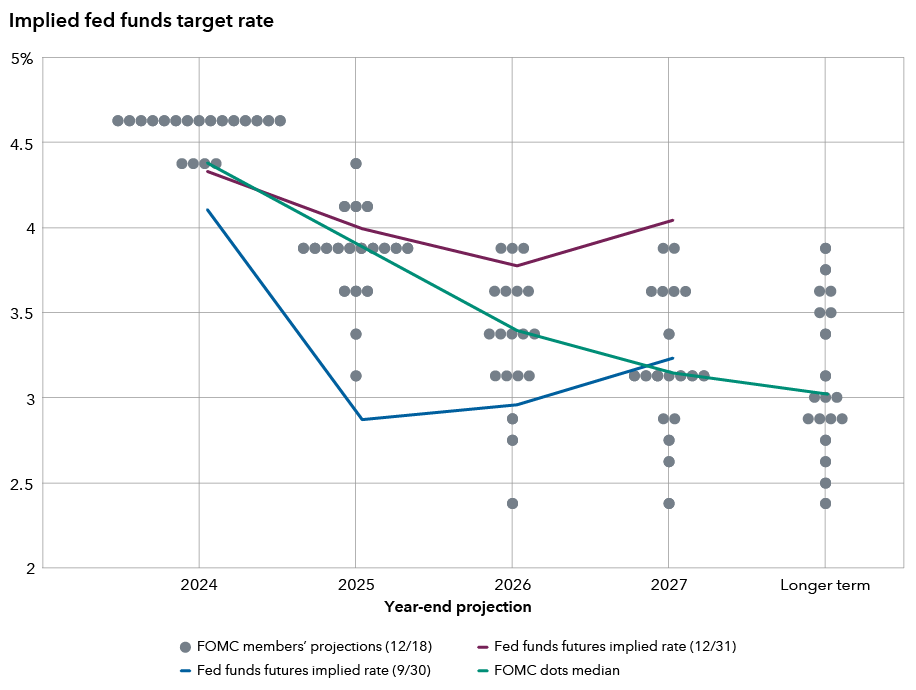
Source: LSEG Datastream. Data as of 12/31/2024.
Could the term premium increase due to higher deficits and lead to higher long-term rates?
The term premium is the additional yield that investors require for holding long-term bonds as opposed to owning a series of shorter term bonds. There are many factors that go into calculating the term premium, but most models show that it has been negative for much of the last decade. One contributing factor to the negative term premium has been the expansion of the Federal Reserve’s balance sheet post the 2008 financial crisis. Federal budget deficits are expected to continue in the coming years, which will lead to debt issuance at current levels and possibly higher. The Congressional Budget Office forecasts that the budget deficit is expected to be $1.8 trillion for fiscal year 2025. This is on par with the budget deficit in 2024. Those deficits may expand under the policies of the Trump administration, but it is still too early to tell. Some question whether or not the continued issuance of U.S. Treasury bonds will be met with enough buyers and keep interest rates in a reasonable range. We published a paper highlighting that the buyer base for U.S. Treasuries is now dominated by domestic buyers as opposed to foreign buyers.
The last time the Federal Government was compelled to address a growing budget deficit was when President Bill Clinton worked with a Republican Congress to pass the Balanced Budget Act of 1997. Prior to the act’s passage, interest rates had climbed higher, but this was largely due to a change in monetary policy. The Federal Reserve was trying to get ahead of a strong economy and kept rates elevated for an extended time to keep inflation in check. The term premium during this period actually declined, although 10-year Treasury rates briefly traded higher than nominal GDP. While it makes intuitive sense to link the term premium to budget deficits, the term premium has historically been more tied to levels of inflation. This has occurred with a considerable lag of between two and three years. Thus, while an increase in the budget deficit may not lead to an increase in the term premium, history suggests that the recent bout of inflation could ultimately be the actual catalyst for higher term premiums. However, any increase in the term premium may be met by further bond purchases from the Federal Reserve.
U.S. term premium has been negative as deficits rose
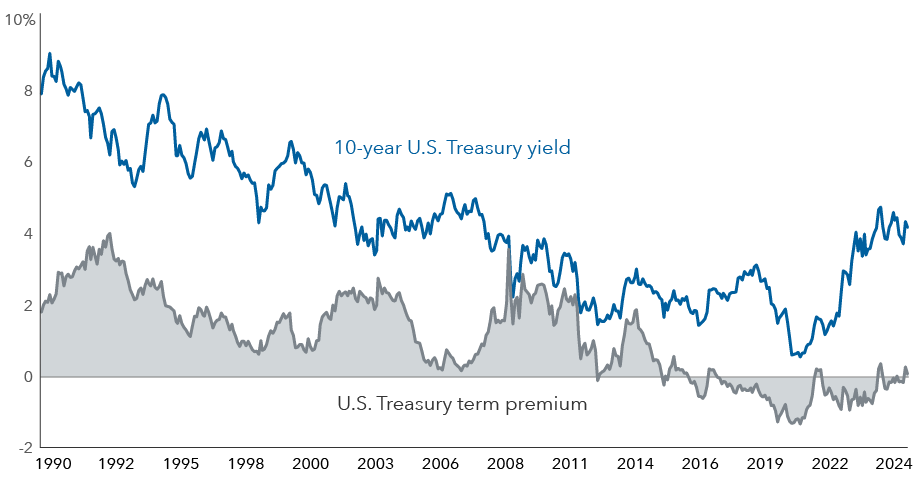
Source: LSEG Datastream. Data as of 12/31/2024.
So, what does this all mean for investors?
The last two years have shown interest rates can trade within a range even if they are influenced by economic data, Federal Reserve policy and political changes. While the level of nominal GDP can help to frame the potential upper level that long-term Treasury yields can reach, the path of Federal Reserve policy will have an important impact on short-term interest rates. We expect interest rates to continue to trade in a range while the yield curve continues to steepen at a moderate pace as the Federal Reserve lowers its policy rate. Longer term rates are likely to continue to be impacted by economic data and policies pursued by the new Trump administration. Investors looking to lock in higher levels of yield should use this volatility to their advantage, putting money to work in longer duration assets after big moves higher in long-term rates. As always, the future remains uncertain, but we think investors can use better valuations presented by market volatility to their advantage.
Learn more about
Yield curve — A measure of the difference between the yields of bonds of different maturities. A yield curve is said to be inverted when shorter term bonds provide higher yields than longer term bonds.
Don't miss our latest insights.
Our latest insights
RELATED INSIGHTS
-
Market Volatility
-
Municipal Bonds
-
Long-Term Investing
Don’t miss out
Get the Capital Ideas newsletter in your inbox every other week
Investments are not FDIC-insured, nor are they deposits of or guaranteed by a bank or any other entity, so they may lose value.
Investors should carefully consider investment objectives, risks, charges and expenses.
This and other important information is contained in the prospectuses and summary prospectuses, which can be obtained from a financial professional and should be read carefully before investing.
Statements attributed to an individual represent the opinions of that individual as of the date published and do not necessarily reflect the opinions of Capital Group or its affiliates. This information is intended to highlight issues and should not be considered advice, an endorsement or a recommendation.
All Capital Group trademarks mentioned are owned by The Capital Group Companies, Inc., an affiliated company or fund. All other company and product names mentioned are the property of their respective companies.
Use of this website is intended for U.S. residents only.
Capital Client Group, Inc.
This content, developed by Capital Group, home of American Funds, should not be used as a primary basis for investment decisions and is not intended to serve as impartial investment or fiduciary advice.