Fixed Income
As we navigate a new era of fiscal dominance, the bond market is poised for a very different year in 2025 compared to years past.
For a long time, fixed income investors have viewed central banks as a primary driver of markets — whether it was the ultra-low rates of the 2010s aimed at boosting economic growth and combating persistently low inflation, crisis interventions to stabilize markets and the economy during the COVID-19 pandemic, or the subsequent moves to sharply raise interest rates in response to soaring inflation. Overall, central bank actions and their forward-looking guidance have been front and center as a leading indicator for economic growth, inflation and ultimately markets.
I believe 2025 will be different. Instead of being a principal driver of markets, I see the U.S. Federal Reserve taking a back seat and responding to market events after they occur. Investors will likely hear the Fed maintain a refrain of “data dependence” and “economic uncertainty” and a “meeting-by-meeting” approach. With U.S. economic growth expected to remain above 2% and inflation back within range of the Fed’s 2% target, the Fed can afford to take a more patient approach.
As the Fed’s stance becomes less influential, markets will instead be taking their cues from the other dominant macro force: governments. Fiscal spending and policies — on everything from trade and immigration to taxes and regulation — are all highly important to the future path of growth and inflation. With U.S. policies in flux, I believe market volatility will remain elevated, leading to both higher risk and greater opportunity for investors and active managers that can successfully navigate this period of fiscal dominance.
Against this backdrop, here are five themes that I anticipate will drive core bond portfolios in 2025:
1. The macro backdrop may be favorable, with healthy growth and contained inflation
As president-elect Donald Trump prepares to take office and enact policy changes, I anticipate that U.S. growth may be stronger than previously expected. I see the economy benefiting from a more business-friendly climate defined by potential deregulation and tax cuts. I also anticipate that inflation may be stickier than previously estimated, with tariffs and immigration policies potentially affecting the pace of price increases.
The U.S. economy is on solid footing with healthy forecasted growth
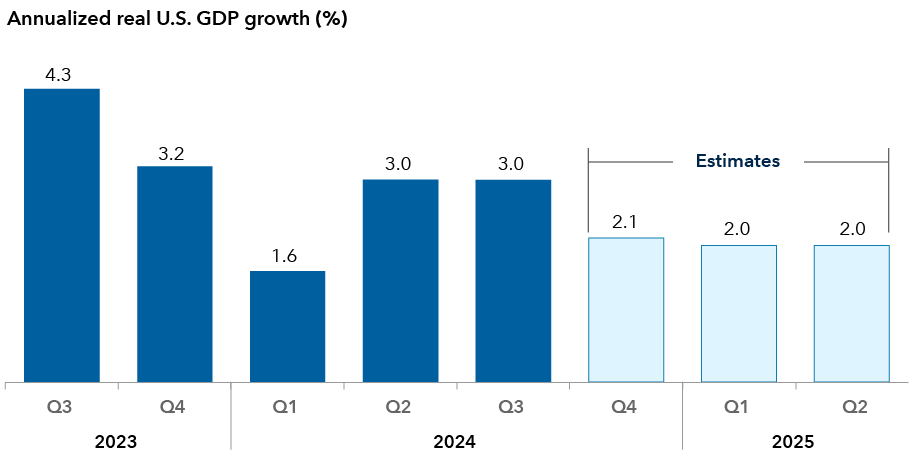
Sources: Capital Group, Bureau of Economic Analysis, FactSet. As of December 20, 2024. Estimates for Q4 2024 and 2025 are based on the mean consensus estimate from FactSet.
Still, I’m not overly concerned about a sustained spike in inflation. I see a variety of factors that may help offset the impact of potentially inflationary fiscal policies, including a decline in shelter inflation being gradually reflected in the consumer price index (CPI), the deflationary effect of a strong U.S. dollar, and the prior Trump administration’s track record of enacting tariffs without igniting inflation.
2. Elevated interest rates and rate volatility may offer opportunities
With U.S. economic growth at or above 2%, inflation stubbornly above target, and financial asset prices at or near record levels, I believe it will be hard for the Fed to argue that monetary policy is currently restrictive. I expect the Fed will take a measured approach to further reducing interest rates in 2025, with perhaps only one to two 25-basis-point cuts, as it takes its time to assess the impact of fiscal policy on the outlook for growth and inflation. In this environment, I anticipate the 10-year Treasury yield will remain range-bound, potentially trading between 4% and 5%. It’s also my view that rate volatility, which has been elevated over the past few years, will remain so in the near term.
In this environment, yield curve and duration positioning may present opportunities to play both offense and defense. Risks to taking duration exposure appear better balanced and could be appealing over the medium term, while swings in interest rates higher and lower may offer opportunities to lean against potential market overreactions.
Rate volatility increased amid Fed rate actions and remains elevated
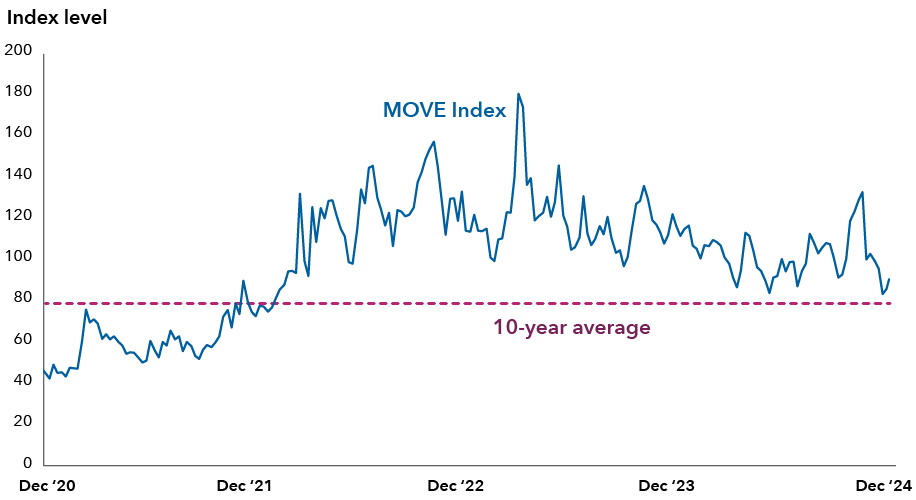
Source: Bloomberg. As of December 18, 2024. Index shown is the ICE BofA U.S. Bond Market Option Volatility Estimate (MOVE) Index, which tracks volatility across U.S. Treasuries. It measures the implied yield volatility of a basket of one-month, over-the-counter options on two-year, five-year, 10-year and 30-year Treasuries.
While yield curves have finally begun normalizing from their deeply inverted levels of 2024, I believe this process still has room to run. Yield curves remain relatively flat against the backdrop of a more normalized growth and inflation environment. Moreover, there is the potential for additional steepening if the new administration’s policies prove more inflationary than expected or if government deficits and Treasury supply remain high. Positioning for a steeper yield curve may also have the benefit of providing a measure of downside protection to core bond portfolios in case economic growth expectations fall or an unexpected shock surprises the market.
3. Higher quality bonds offer better value
Spread compression has been sweeping in its depth and breadth. The differential between higher and lower quality opportunities has narrowed, with compensation for risk falling to historically low levels. This dynamic has played out across markets, from structured products to investment-grade (BBB/Baa and above) corporates to high yield, as well as within each market, such as between higher and lower rated corporate credit.
Spread premiums for holding riskier debt are compressed across the board
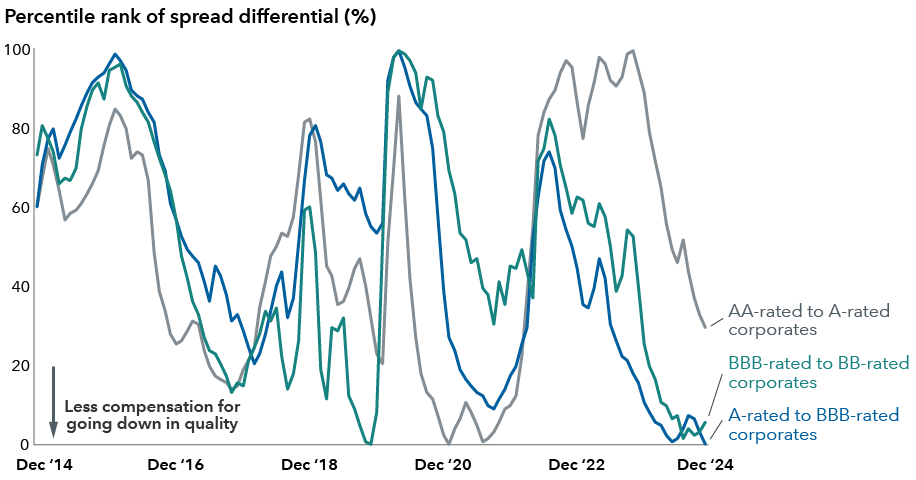
Source: Bloomberg. Data as of December 31, 2024. Figures represent the percentile ranking on a rolling three-month average basis of the difference in option-adjusted spreads between the indexes over the period shown. Indexes used are the AA, A and BBB subsets of the Bloomberg U.S. Corporate Investment Grade Index, and the BB subset of the Bloomberg U.S. Corporate High Yield Index.
Paltry incremental spreads are not adequately compensating core bond investors for increased risk. Spreads on the Bloomberg U.S. Corporate Investment Grade Index fell to record lows in late 2024 and reached 80 bps as of December 31, 2024. These tight spreads suggest an unfavorable asymmetry, as a relatively small shock has the potential to wipe out incremental returns. For example, a widening of just 10 to 12 bps in investment-grade spreads could potentially generate enough of a price drop, based on the index’s average duration of about seven years, to wipe out a year’s worth of excess carry on those holdings.
Given a positive economic backdrop, some investors may be tempted to reach for yield and take on more risk. But, for core bond investors in particular, I believe this would be a mistake. Leaning into lower quality debt at current valuations may eat up investors’ risk budgets by adding risk while potentially adding little to no incremental return.
In my view, this compression in valuations is creating a rare opportunity for core bond investors to move up in quality without sacrificing yield, and potentially even providing an increase in yield. Shifting to higher quality bonds can mean moving up the ratings spectrum, such as from BBB-rated to A-rated corporate bonds, or upgrading quality across other dimensions. For example, high-quality securitized bonds, as the name conveys, are secured in nature compared to the unsecured profile of a typical corporate bond. Parts of the structured credit and agency mortgage-backed security (MBS) market reflect AAA-rated bonds with minimal credit risk and strong liquidity. They have nominal yields and spreads that rival or exceed those of many lower rated corporate bonds, offering attractive return potential for investors while they wait for a more compelling entry point in corporate credit.
Volatility profiles vary significantly across sectors and the ratings spectrum
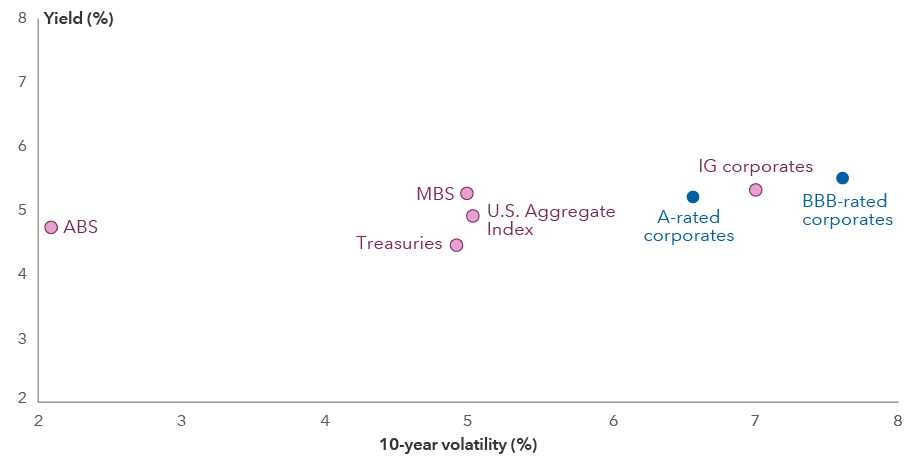
Source: Bloomberg. As of December 31, 2024. Figures reflect yield to worst as of December 31, 2024, and annualized standard deviation for the period from December 2014 to December 2024. Indexes shown are the Bloomberg U.S. Asset-Backed Securities Index (ABS), Bloomberg U.S. Mortgage Backed Securities Index (MBS), Bloomberg U.S. Aggregate Index (U.S. Aggregate Index), Bloomberg U.S. Corporate Investment Grade Index (IG corporates), A-rated subset of the Corporate IG Index (A-rated corporates), BBB-rated subset of the Corporate IG Index (BBB-rated corporates), and Bloomberg U.S. Treasury Index (Treasuries).
Higher quality investment-grade bonds may deliver results similar to their lower quality peers while providing much greater downside protection potential. Drawing on my observations from market cycles across my career, I fully expect dispersion across credit quality to increase again in the coming years and reward a more defensive posture.
Instead of playing offense, I will increasingly use security selection to play defense in portfolios. High-quality issuers in industries ranging from pharmaceuticals to utilities and top-tier financials can be attractive in a risk-off environment given their more defensive profile. And security selection within both securitized credit and the large variety of agency MBS coupons offer compelling opportunities with very attractive yields and minimal credit risk.
4. Correlations are likely to revert to historical norms
The Fed’s aggressive rate-hiking campaign, aimed at taming inflation, upended the traditional relationship between stocks and bonds. When CPI peaked at 9.1% in 2022, it was the first year in decades that bonds fell alongside stocks. High inflation forced the central bank into a policy of sacrificing future growth to fight inflation. In this environment, rather than using rate cuts to offset weaker growth, the Fed actively pursued slower growth by hiking interest rates. This led to negative results for both asset classes.
Inflation has since dropped significantly, with CPI reaching 2.7% in November. With inflation much closer to the Fed’s target, the Fed is no longer trying to engineer slower growth and is instead looking to maintain the current level of growth with stable inflation. This pivot is incredibly important to bond investors because it is the key factor that may allow the stock/bond correlation to revert to historical norms. In response to the next growth shock that negatively impacts equity valuations, the Fed now has the ability to cut interest rates to bolster economic growth, leading yields to fall and bond prices to rise. High-quality bonds may once again provide diversification to equities and other risk assets in potentially adverse market environments.
Importantly, the potential diversification benefit for core bond investors is higher than it’s been in decades. Given the current high level of the federal funds rate, the Fed can meaningfully cut rates if needed to support growth, potentially pushing bond returns into double-digit territory in the event of a negative economic surprise.
Multi-asset portfolios that incorporate high-quality bonds may achieve superior risk-adjusted returns, with the tradeoff that bonds should enhance returns if the equity market wobbles and dampen returns if equities continue to reach new highs.
Bonds appear to have resumed their ability to provide diversification during equity sell-offs
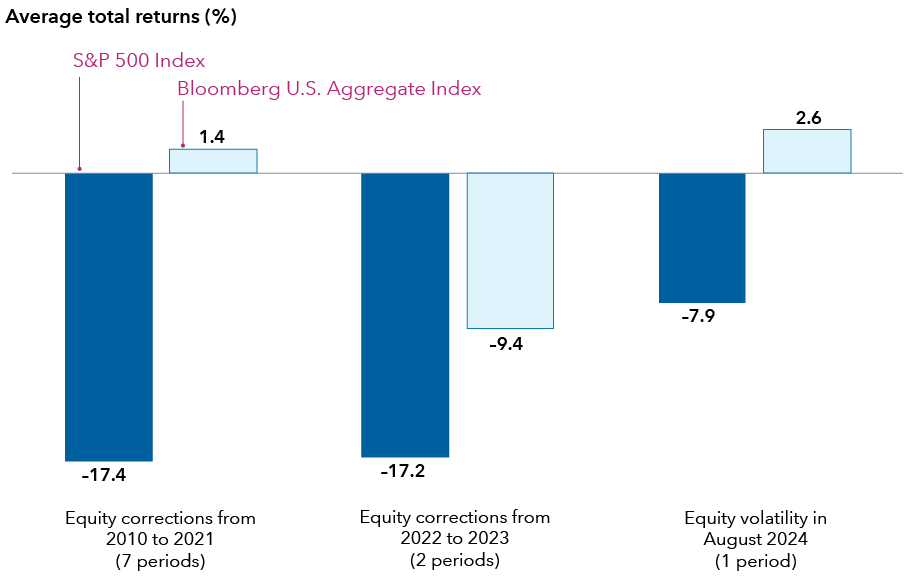
Sources: Capital Group, Morningstar, Bloomberg. Data as of December 31, 2024. For equity correction periods in 2010-2023, figures were calculated by using the average cumulative returns of the indexes during the nine equity market correction periods since 2010. Corrections are based on price declines of 10% or more (without dividends reinvested) in the S&P 500 Index with at least 75% recovery. The cumulative returns are based on total returns. Ranges of returns for the equity corrections measured: S&P 500 Index: -34% to -10%; Bloomberg U.S. Aggregate Index: -14% to 5%. For the equity volatility period in July/August 2024, returns are based on the period from July 15, 2024, to August 5, 2024.
5. Technical factors may be supportive of fixed income
Following a strong year for inflows to bond funds in 2024, I believe structural allocations to fixed income will continue to grow. With yields on the Bloomberg U.S. Aggregate Index of about 5%, investors can capture significantly more income potential versus the index’s 10-year average of about 2.9%. Higher starting yields have historically meant higher forward returns. And core bond investors could also receive the potential for double-digit returns if growth expectations falter. This combination of higher return potential with compelling downside protection potential could lead to higher fixed income allocations in 2025.
In addition, with equity and many other asset classes at or near record-high valuations, investors may increasingly seek to preserve their significant gains and compound them through elevated bond yields. Even rebalancing back to investors’ neutral equity/bond allocation — as portfolios are likely skewed toward stocks given the strength of recent equity market gains — would likely lead to significant fixed income demand, further supporting demand for the asset class.
Relatively high starting yields suggest strong return potential for core bonds
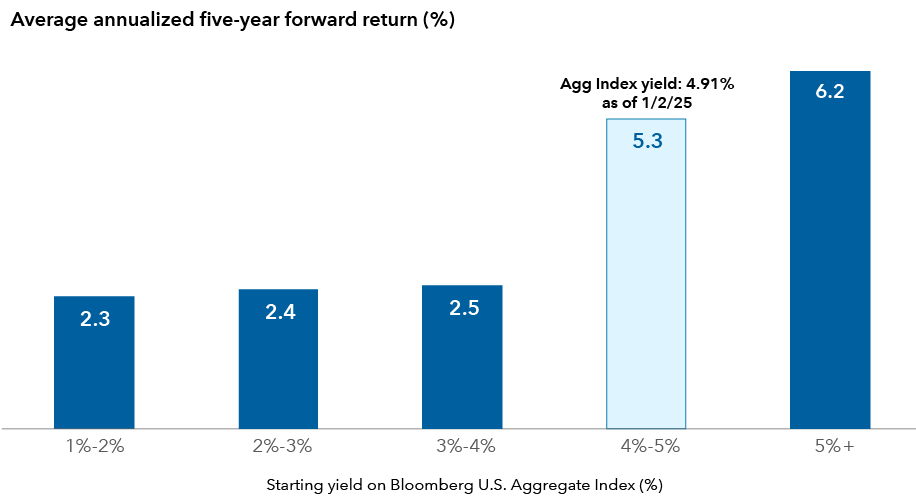
Source: Bloomberg. Data for returns as of November 29, 2024. Return figures reflect the average five-year forward annualized return of the Bloomberg U.S. Aggregate Bond Index (“Agg Index”), grouped by starting yield to worst, from November 2004 to December 2019.
The bottom line for bond investors
With healthy U.S. economic growth, high starting yields and inflation more in check, core bonds are poised to deliver positive returns in 2025.
The current landscape offers a chance to construct a high-quality, high-yielding portfolio that may provide attractive return potential and a measure of downside protection across various scenarios. If 10-year Treasury yields remain range bound at 4% to 5%, carry will be an important component of total return and price appreciation less so. However, the Fed now has ample room to cut rates in the case of a negative economic shock, leading to a very attractive risk/reward profile for high-quality fixed income. Amid an era of fiscal dominance, I see greater opportunities in store for investors and active managers who can successfully navigate this new landscape. Demand for core fixed income is expected to remain very strong in 2025, with core bonds once again poised to diversify portfolios while generating meaningful total returns.
Past results are not predictive of results in future periods.
The S&P 500 Index is a market-capitalization-weighted index based on the results of approximately 500 widely-held common stocks.
Bloomberg U.S. Aggregate Index represents the U.S. investment-grade fixed-rate bond market.
Bloomberg U.S. Corporate Investment Grade Index represents the universe of investment grade, publicly issued U.S. corporate and specified foreign debentures and secured notes that meet the specified maturity, liquidity and quality requirements.
The Bloomberg U.S. Corporate High Yield Index measures the USD-denominated, high yield, fixed-rate corporate bond market.
Bloomberg U.S. Mortgage Backed Securities Index is a market-value-weighted index that covers the mortgage-backed pass-through securities of Ginnie Mae (GNMA), Fannie Mae (FNMA), and Freddie Mac (FHLMC).
Bloomberg ABS Index represents the universe of U.S. asset-backed securities.
Bloomberg U.S. Treasury index represents the public obligations of the U.S. Treasury with a remaining maturity of one year or more.
Duration measures a bond’s sensitivity to changes in interest rates. Generally speaking, a bond's price will go up 1% for every year of duration if interest rates fall by 1% or down 1% for every year of duration if interest rates rise by 1%.
A yield curve illustrates the yields on similar bonds across various maturities. An inverted yield curve occurs when yields on short-term bonds are higher than yields on long-term bonds. Yield curve steepening occurs when long-term rates rise more than short-term rates, or short-term rates fall more than long-term rates.
Carry is the difference between a bond’s yield and cost to finance its purchase.
Standard deviation is a common measure of absolute volatility that tells how returns have varied from the mean over time.
Yield to worst is the lowest yield that can be realized by either calling or putting on one of the available call/put dates or holding a bond to maturity.
Option-adjusted spread is a yield-spread calculation used to value securities with embedded options.
Don't miss our latest insights.
Our latest insights
RELATED INSIGHTS
Don’t miss out
Get the Capital Ideas newsletter in your inbox every other week
 Pramod Atluri