Fed
 Timothy Ng
 Jared Franz
The Federal Reserve reduced its benchmark interest rate for the first time since 2020 with a 50-basis-point cut, as inflation has largely come under control and labor markets have begun displaying signs of distress. This is a major turning point for investors and could have significant implications for both equity and fixed income portfolios.
The decision to eschew a traditional 25-basis-point cut and lower the federal funds rate to a range of 4.75% to 5% shows the Fed is confident the disinflation trend will continue, and it has shifted its focus from the upside risks of inflation to the downside risks in the labor market.
What does this mean for investors? Fixed income portfolio manager Tim Ng and economist Jared Franz gave their views and took your questions in our instant reaction webinar. Below are some highlights shared at the webinar:
Fed takes out insurance with jumbo rate cut
Tim Ng: If you listen to what Federal Reserve chair Jerome Powell said, the decision to cut by 50 basis points can be interpreted as a risk management exercise. The Fed currently sees policy rates as restrictive and given that the downside risks in the labor markets have increased, they want to start to scale back that level of restriction. I think the larger cut was done in an attempt to provide some buffer in case the economy weakens more rapidly than they expect.
When Powell spoke at Jackson Hole in August, he laid out a clear path where the Fed's focus has started to shift from high inflation to downside risk in the labor market. He indicated they did not want to see further cooling in labor market conditions. We also learned from the minutes of the July meeting that it was a close call not to cut rates at that time. Since then, we've had a few softer payroll reports. Job openings declined more than expected, and we had some benign inflation readings that suggested the disinflationary trend in inflation was intact.
Will we see another 50 bps cut again?
Tim: It remains to be seen if the Fed will continue moving in 50 bps increments. Cutting rates by 50 bps now has opened the door to the possibility of going 50 again, if they need to. The SEP (Summary of Economic Projections) is forecasting only 50 bps of additional cuts in total for the rest of 2024, but if you look at the distribution of the dots (which represent individual Fed governors’ projections) it's not exactly a consensus view that they're only going to do 50 bps of cuts.
The first of many cuts? Interest rates are projected to fall
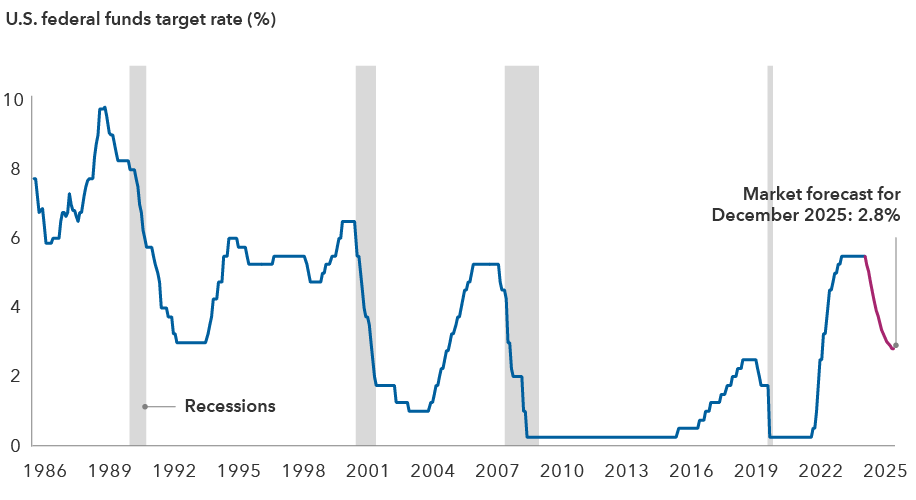
Sources: Capital Group, Bloomberg, Chicago Mercantile Exchange Group, Federal Reserve, National Bureau of Economic Research. Since 2008, the Federal Reserve has set its target policy rate as a range between an upper and lower limit. The chart shows the upper range when applicable. Data as of September 18, 2024.
The answer will ultimately depend on the labor market. The Fed’s governors have increased their forecast for the unemployment rate from 4.2% to 4.4% by the end of 2024. If the unemployment rate surprises to the upside, and we get to 4.4% in the next month or two, they may feel the need to take out a little bit more insurance by cutting by 50 bps again. Powell will also likely be cautious not to pigeonhole the Fed by signaling their intent ahead of time. Markets are currently pricing in a total of 72 basis points for the next two meetings. That is basically saying it’s a 50/50 chance between 25 bps and 50 bps, depending on where the data lines up.
The Benjamin Button economy and business cycle
Jared Franz: In the 2008 movie Benjamin Button, the main character, played by Brad Pitt, ages in reverse. I see similar parallels with the current U.S. economic conditions. When the yield curve first inverted in 2022, many thought the U.S. economy had reached a late cycle, since historically, an inverted yield curve has been an accurate predictor of recessions. However, that has not happened, and I’ve sought to be more flexible in my framework.
I believe the U.S. economy is reversing back to a mid-cycle stage. We are in a different set of circumstances than we’ve seen in the past. Geopolitics are different. Domestic politics are different. And we are dealing with the complexities of a post-COVID economy.
Looking to 2025, I think the U.S. economy is exhibiting characteristics more in line with conditions seen in normal historical mid-cycle periods, rather than late cycle or recessionary conditions. Overall, I believe the economy is fundamentally solid.
Equity markets remain constructive on the outlook
Jared: Equity markets are also pricing in a constructive environment. Aggregate earnings growth for the S&P 500 has been coming through this year, and consensus estimates suggest earnings should grow for companies in various industries for the rest of this year and into 2025. To be sure, earnings projections can change either to the upside or downside. But so far, the outlook is positive. Plus, the U.S. equity market is showing signs of broadening outside the Magnificent 7 megacap technology companies in terms of price returns.
I would also highlight that this current U.S. business cycle could last longer than some may think, given that we are moving into a new technology cycle, driven by artificial intelligence, as well as massive manufacturing investment spurred by the reshoring of supply chains. This level of spending should be beneficial for an array of companies in different industries.
Credit market fundamentals look strong
Tim: All else equal, lower policy rates and easier Fed policy should be positive for risk markets, and credit spreads and the economy. This is especially true if the Fed is easing at a time when the economy is still doing well. Growth is still strong. Even though the unemployment rate has risen, the U.S. is still adding quite a bit of jobs every month, and 4.2% unemployment is still very low, relative to historic standards. There's nothing in credit fundamentals that would suggest to us that credit is in trouble. Corporate profits are still very healthy. Corporate margins are still elevated, and defaults are low. Companies have refinanced quite a bit of debt, so they have a lot of cash on hand. When you add that with easier Fed policy, that's generally a positive landscape for risk assets and credit.
Positioning in bond portfolios
Tim: Our positioning on interest rates remains a bit cautious, not because we have a significantly pessimistic view about the economy, but because of our view of valuations and the probabilities we see on a range of plausible Fed actions. We are focused on what the Fed is telling us and how they're behaving. We are trying to understand the reaction function relative to the economic data that we have today and how that could change in response to new data.
Fed policy appears to be biased toward lower rates and not higher rates. They don't have a recession in their forecast. They have GDP at 2% in the next few years and unemployment peaking at 4.4%, which is above where we are now but low based on historical standards. Against that backdrop, they still have 150 bps of additional cuts penciled in for the next year. That tells you they likely think that current policy rates are too restrictive, and dialing some of that back is fair, even in a benign economic outcome. On top of that, Powell has said they will react aggressively if they see further deterioration in the labor market, which could put pressure on interest rates.
Falling rates have supported bond returns
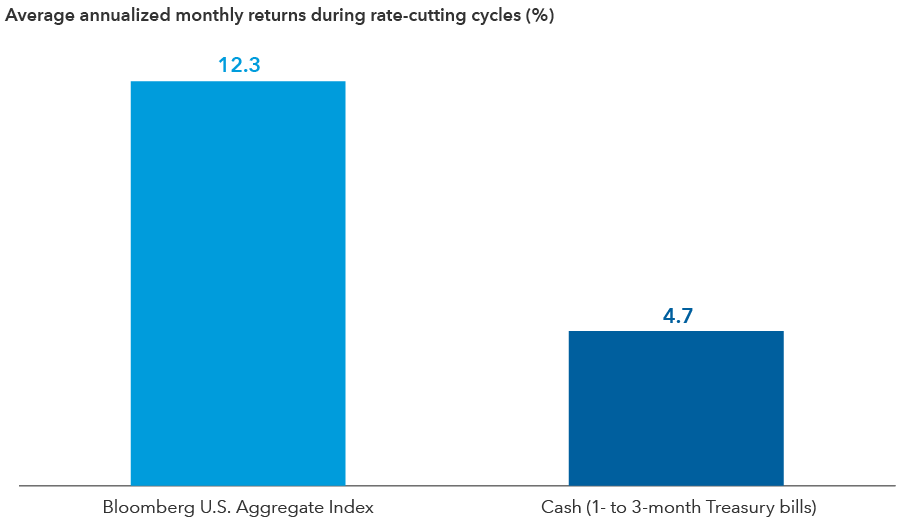
Sources: Capital Group, Bloomberg. Based on average monthly returns during rate cutting periods from September 1984 through September 11, 2024. Past results are not predictive of results in future periods.
On the other hand, for them to reverse course and hike rates, inflation likely will have to show signs of reaccelerating, not just remain sticky above the Fed's target. That's a scenario where interest rates could rise. And I think, at the moment, we're not seeing many signs that inflation has yet hit bottom.
When we on the rates team piece that all together, it leads us to be positioned in a way that would benefit if policy rates fell further. The highest conviction view out of the rates team is in a yield curve steepener i.e., positioning for front-end yields to fall faster than long-end yields and/or long-end yields to rise faster than front-end yields, and a renormalization of the curve back to a more positive slope.
We've been in this position for almost two years, and we were a bit early, but we're glad to see it work now. One of the big reasons we’ve had this strong view is that we believed the Fed's hiking cycle would end and that they would pivot to a cutting cycle. Now that they’ve just delivered the first cut in a series of cuts, in our view, this is the time when the curve could start to steepen more significantly.
Implications of balance sheet runoff
Tim: There is a disconnect in the sense that the Fed is easing policy rates while also letting the balance sheet run off. Those functions tend to operate in different directions, in terms of impacting whether policy is easy or tight. But I think the Fed has done a good job to distance those two policies to date. Their balance sheet policy is meant to help with liquidity and market functioning. It's supposed to be a passive thing that's not actively moved up and down, whereas rates are the preferred tool used to calibrate policy relative to economic conditions.
One implication of running down the balance sheet while cutting rates is that it should help the curve to steepen. A big reason why the yield curve has been as inverted as it has is because of the size of the balance sheet. The Fed has obviously ballooned its balance sheet quite a bit since the pandemic, in trying to prop up the financial markets and economy. That had a net effect of suppressing term premium, suppressing volatility and driving all risk assets up.
So, if they're unwinding the balance sheet, the reverse of that should play out. I think this is part of the reason why the curve is steepening as it has over the last couple of months.
What is the neutral rate?
Jared: Whenever I think about the neutral rate, I think about uncertainty embodied in any precise estimate. As Powell said at the press conference, ’We only know [the neutral rate] by its works’ … you only know when you get there and by the way the economy reacts.
That said, I think it's higher than it was over the last couple years. I think evidence for that is seen in how the productivity numbers in the U.S. have rebounded. Productivity is above where it was pre-pandemic and has really diverged from other developed market economies, like Europe, Japan and Canada.
If you force me to give you a number, it would be something like 1.5% over inflation. So, if inflation stays around roughly 2% to 2.5%, my nominal neutral rate would be around 3.5%. That's important for the outlook, because it is a little higher than what the Fed has right now, with its long run median dot at 2.9%.
The Fed’s estimate of neutral is what they're going to go for. If the Fed continues to think that their neutral rate is lower than what I believe it to be, the implication for us as market participants and allocators of capital is that they're likely going to provide dollar-for-dollar more stimulus than the economy needs. That could mean the outlook for risk assets is a little better, but it also could mean that the inflationary implications are higher as well.
Inflation is decreasing slowly but has not reached its 2% mandate and is above pre-COVID levels. There are still components of inflation that remain high and volatile, such as apartment rents, home and auto insurance. It’s not time for the Fed to spike the football in the end zone. The final mile may not be as smooth as some think. The lesson we've learned from the 1970s and ‘80s is that the Fed does not want to cut rates too soon and too aggressively.
Declining money market yields could bring investors back to longer duration assets
Tim: A lot of assets moved into the money markets in recent years, given money market yields were very attractive. If there was uncertainty about where the economy was heading, why not earn 5.5% in money markets while you wait? But as yields fall, and those money market rates decline, that calculus becomes a little bit more difficult.
Now you're not getting as much yield waiting around, and you run the risk of missing out on capital appreciation that comes with having more duration in your portfolio as yields fall. Historically, we've seen more assets move into longer duration bonds when yields have fallen, and I think we've already seen some of that happen this year. I expect this trend to continue as the Fed continues to cut rates. I think some of that flow will go into both equities and bonds, but in terms of relative scale, it will likely depend on the outlook for the economy, valuations and market sentiment between the two asset classes.
Long-term dollar forecast remains constructive
Jared: The U.S. dollar has come under pressure lately, but that’s not surprising given where we are in the Fed rate-cutting cycle. Taking a longer term view, our currency analyst at Capital Group has a view that the dollar could remain strong in the near term. It’s based on the idea that there’s something interesting and different right now about the U.S. economy, both in its resilience and its level of innovation, entrepreneurship, AI development and productivity. The U.S. economy continues to be exceptional in those areas, and if that persists, the dollar could remain strong in the years ahead.
The Magnificent Seven – The seven largest contributors to the S&P 500 in 2023. The companies are Alphabet, Amazon, Apple, Meta Platforms, Microsoft, NVIDIA and Tesla.
Yield curve measures the difference between the yields of bonds of different maturities. A yield curve is said to be inverted when shorter term bonds provide higher yields than longer term bonds.
Credit spread is the difference in yield (the expected return on an investment over a particular period of time) between a government bond and another debt security of the same maturity but different credit quality. Credit spreads typically measure the perceived riskiness of a corporate bond relative to a safer investment, typically the equivalent government bond; the wider the spread, the riskier the corporate bond. A period of widening (increase in the spread) reflects an increase in this perceived credit riskiness.
Term premium is the compensation that investors receive for the risk that interest rates may change over the life of the bond.
Bloomberg U.S. Aggregate Index represents the U.S. investment-grade fixed-rate bond market.
S&P 500 Index is a market-capitalization-weighted index based on the results of 500 widely held common stocks.
Don't miss our latest insights.
Our latest insights
-
-
Emerging Markets
-
Global Equities
-
Economic Indicators
-
RELATED INSIGHTS
-
-
Economic Indicators
-
Manufacturing
Don’t miss out
Get the Capital Ideas newsletter in your inbox every other week