Artificial Intelligence
Categories
Chart in Focus
Once undervalued, dividend stocks are narrowing the gap
 Marc Nabi
September 11, 2024
For the better part of the past 15 years, dividend stocks have lingered in the shadow of growth stocks that powered ahead. As the chart shows, the valuation gap across high-paying dividend stocks is now narrowing. Take utilities for example, often omitted from the conversation of growth stocks, many across the sector appear poised to benefit from increasing electricity demand, largely driven by the growth of data centers for artificial intelligence. The S&P 500 Utilities Sector Index, which yields 3%, is up 20% year-to-date as of September 5, outpacing the 16.5% gain of the S&P 500 Index.
Valuations for high dividend equities are climbing
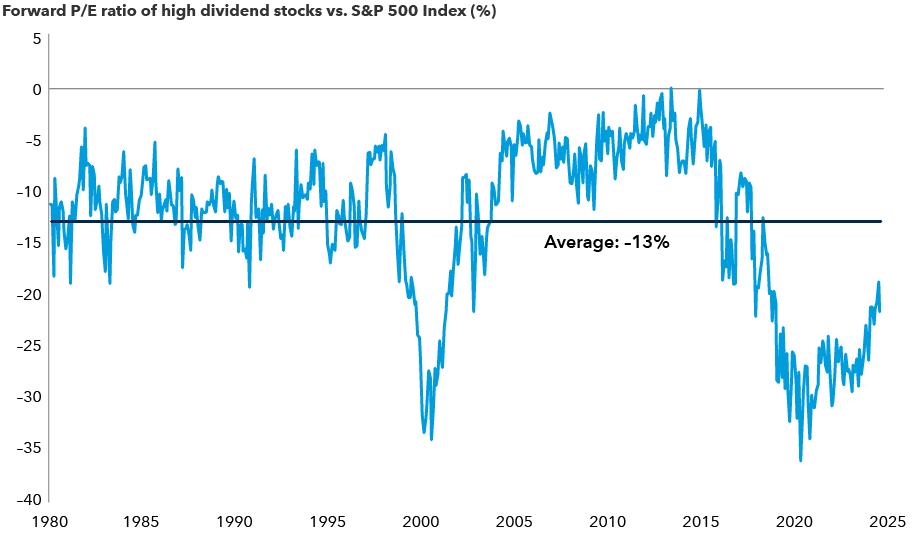
Sources: Capital Group, Goldman Sachs. Data as of June 30, 2024. High dividend stocks refer to the cohort of stocks in the S&P 500 Index with the highest quintile dividend yield (sector-neutral) within the index. The line represents smoothed six-month average. P/E ratio = price-to-earnings ratio.
We’re keeping an eye on other market opportunities, especially semiconductor and aerospace companies that have introduced or increased dividends. Oil companies have exhibited better capital discipline by integrating dividends into their capital allocation plans. European and U.S. banks may also boost dividends at a faster pace, given stronger capital ratios and balance sheets. Overall, the S&P 500 is expected to post a 6% increase in dividend payments for 2024, versus a 5.1% rise in 2023, according to S&P Global. Free cash flow levels for S&P 500 equities are also in good standing, providing companies with the optionality for shareholder-friendly initiatives such as dividend payments.
As the Fed is poised for a rate cut, undervalued dividend-paying stocks could present an attractive opportunity. Market concentration in large technology stocks is a key issue for investors, and dividend-paying equities can benefit from longer term tailwinds, such as reshoring of supply chains.
With over $6 trillion sitting in money market accounts, according to the Investment Company Institute as of September 5, investors may seek alternative income sources if they begin to see the yields on those balances drop. Additionally, any moderation in economic growth could shift their focus on near-term cash flows and dividend-paying companies to boost returns.
Learn more about
The S&P 500 Index is a market-capitalization-weighted index based on the results of 500 widely-held common stocks.
The S&P 500 Utilities comprises those companies included in the S&P 500 that are classified as members of the Global Industry Classification Standard utilities sector.
Past results are not predictive of results in future periods.
Don't miss our latest insights.
Our latest insights
-
-
Health Care
-
Market Volatility
-
Market Volatility
-
Chart in Focus
RELATED INSIGHTS
-
Artificial Intelligence
-
-
Chart in Focus
Don’t miss out
Get the Capital Ideas newsletter in your inbox every other week
Investments are not FDIC-insured, nor are they deposits of or guaranteed by a bank or any other entity, so they may lose value.
Investors should carefully consider investment objectives, risks, charges and expenses.
This and other important information is contained in the prospectuses and summary prospectuses, which can be obtained from a financial professional and should be read carefully before investing.
The indexes are unmanaged and, therefore, have no expenses. Investors cannot invest directly in an index.
Each S&P Index ("Index") shown is a product of S&P Dow Jones Indices LLC and/or its affiliates and has been licensed for use by Capital Group. Copyright © 2026 S&P Dow Jones Indices LLC, a division of S&P Global, and/or its affiliates. All rights reserved. Redistribution or reproduction in whole or in part is prohibited without written permission of S&P Dow Jones Indices LLC.
Statements attributed to an individual represent the opinions of that individual as of the date published and do not necessarily reflect the opinions of Capital Group or its affiliates. This information is intended to highlight issues and should not be considered advice, an endorsement or a recommendation.
All Capital Group trademarks mentioned are owned by The Capital Group Companies, Inc., an affiliated company or fund. All other company and product names mentioned are the property of their respective companies.
Use of this website is intended for U.S. residents only.
Capital Client Group, Inc.
This content, developed by Capital Group, home of American Funds, should not be used as a primary basis for investment decisions and is not intended to serve as impartial investment or fiduciary advice.