Market Volatility
Fixed Income
Inflation, that silent killer of purchasing power, seems to be awakening from its long slumber. A combination of factors sparked inflationary pressure in the United States earlier this year on a scale not seen in decades. By one measure, core consumer inflation increased at a pace last seen in 1991.
Policymakers are prioritizing full employment over price stabilization — preferring that prices run hot for a time to undo the damage of the short but painful COVID recession. But will inflation be temporary, as they expect, or will it persist?
Understandably, all of this is putting a spotlight on U.S. Treasury Inflation-Protected Securities, or TIPS, which are meant to protect investors against large, unexpected shocks to inflation.
While the history of inflation-indexed bonds in the United States goes back to the Revolutionary War, when the Commonwealth of Massachusetts issued “depreciation notes” to soldiers, TIPS are a relatively new and untested asset. Since they were launched in 1997, inflation has been low and stable. However, if the U.S. is indeed entering an environment of high and volatile inflation, our research suggests TIPS can provide a useful inflation hedge.
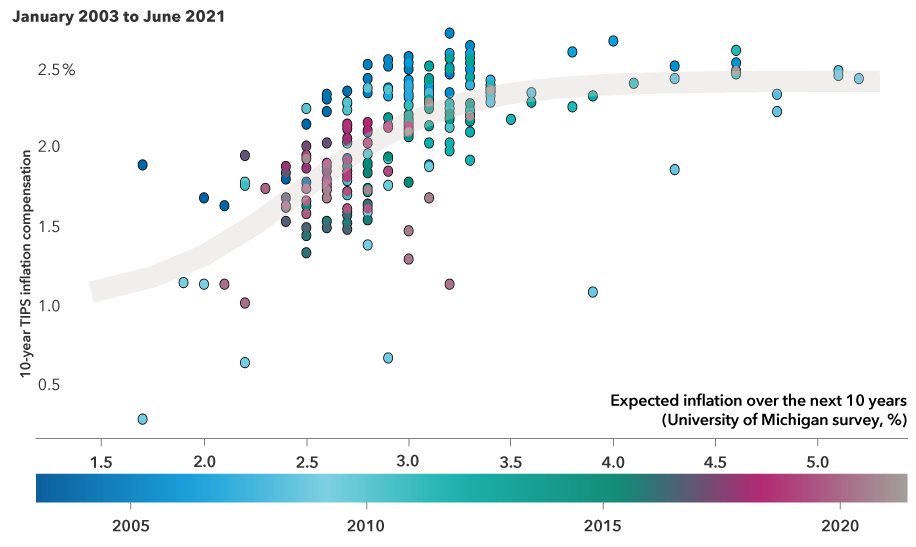
Survey expectations and TIPS inflation compensation

Source: Capital Group using data from the Board of Governors of the Federal Reserve System and the University of Michigan.
The chart above compares survey and TIPS market-based inflation expectations over a period of nearly 20 years — which captures the majority of the trading history of these securities. There is a clear positive relationship, though not always a tight one: Interestingly, the relationship appeared to flatten out during brief periods in 2008 and 2011, when survey inflation exceeded 3.5% but TIPS inflation compensation held stable.
Survey expectations, based on telephone interviews conducted by the University of Michigan, turned out to be incorrect and quickly declined. TIPS market-based inflation expectations were more accurate. During the period in question, the Federal Reserve has had an inflation target of 2% and there were two tightening cycles. The market likely trusted the Fed’s ability to prevent inflation from rising substantially above target, thus placing a ceiling on TIPS inflation compensation.
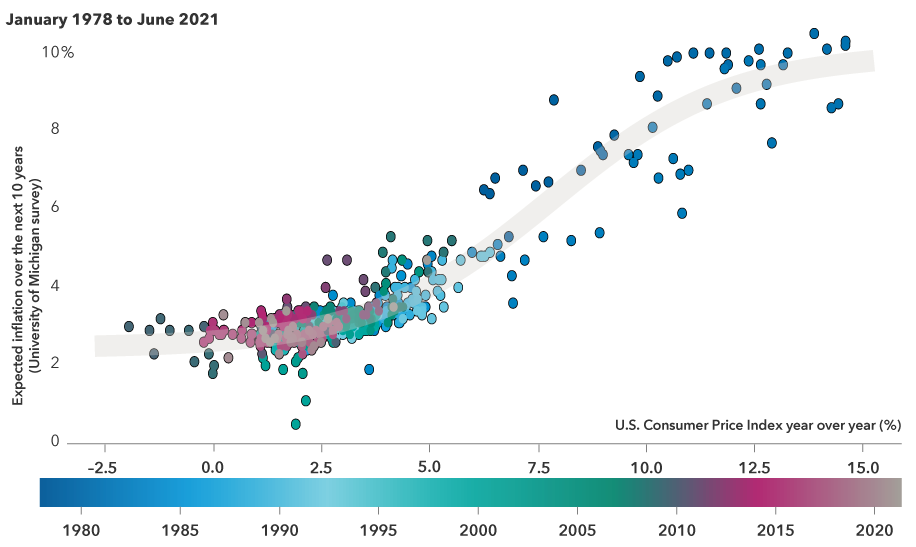
Realized inflation and survey expectations

Source: Capital Group using data from the University of Michigan and the Bureau of Labor Statistics
The chart above goes back more than 40 years to examine the relationship between realized inflation and survey expectations. This includes the very high inflation environment of the late 1970s and early 1980s and indeed shows some tendency for survey inflation to overreact to realized inflation.
Thus, the data suggest that the inflation expectations embedded in the pricing of TIPS securities is more efficient at “looking through” temporary inflation shocks. Yet we expect that TIPS inflation compensation will indeed react to high inflation if it is persistent enough to call into question the Fed’s ability (or willingness) to adhere to its price stability mandate.
TIPS react strongly to realized inflation
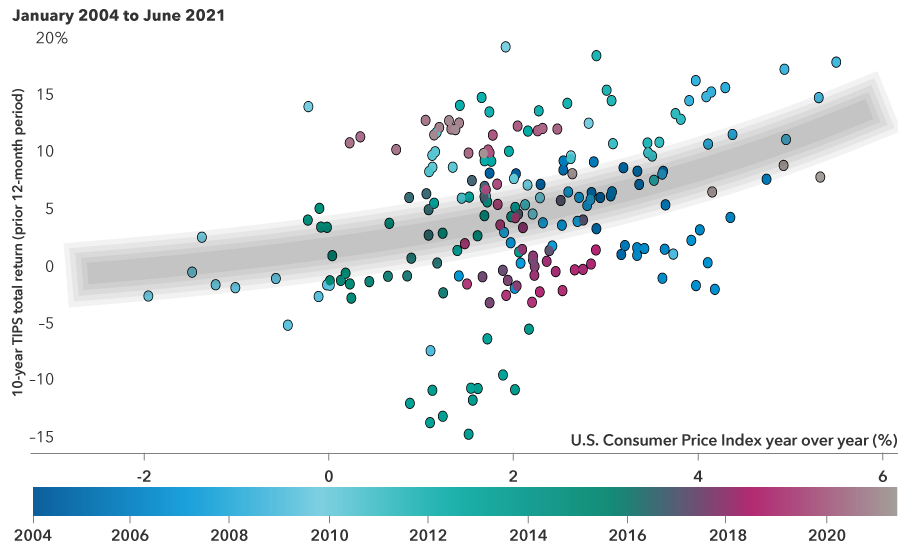
Realized inflation and total returns on TIPS

Source: Capital Group using data from the Board of Governors of the Federal Reserve System and the Bureau of Labor Statistics
We now move from inflation expectation metrics to investment outcomes. The chart above compares the one-year total return on TIPS with realized inflation over the trailing 12 months. One would expect some positive relationship, due to the mechanical link between inflation and TIPS coupon and principal calculations.
In fact, the positive response of TIPS to inflation is magnified because TIPS breakeven inflation tends to expand when realized inflation is high. On average TIPS delivered positive total returns (not just relative returns), which provided an inflation risk hedge for the portfolio as a whole (not just their own share of portfolio income). But over the short term, TIPS have been a fairly unreliable inflation hedge, particularly when inflation has been low.
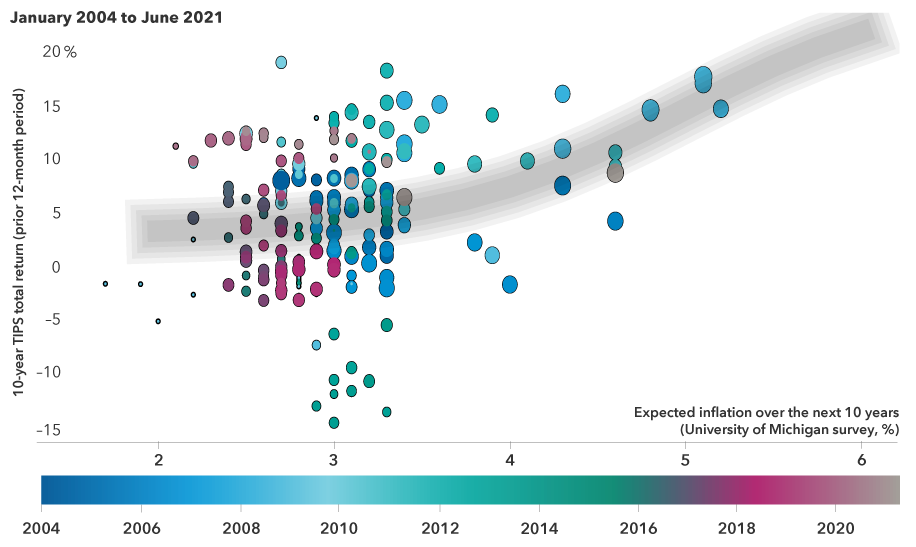
Survey inflation expectations and the total return on TIPS

Capital Group using data from Board of Governors of the Federal Reserve System, Bureau of Labor Statistics and the University of Michigan.
The chart above compares TIPS total returns to survey inflation. Again, there is a strong positive relationship when survey inflation is above about 3.5% but a weaker one in the normal 2.5% to 3.5% range.
Note that in both charts, the period of very negative TIPS returns occurred during the 2013 “Taper Tantrum” — a period of interest rate volatility associated with concerns over Federal Reserve policy tightening — and the late 2014 collapse in oil prices. Both were examples of episodes in which 10-year TIPS were adversely affected by short-term events unrelated to the long-term inflation outlook. We see how passive holdings of TIPS can lead to excessive volatility over the short run. However, this can be mitigated via active management that takes into account the different factors influencing short-run TIPS returns. In fact, active management of TIPS exposures can be a source of added value.
What about the 1970s?
A cross-check of the above argument can be carried out using the work of Jan Groen and Menno Middeldorp, economists with the New York Fed. They analyzed 108 time series dating back to 1971 that were related to real or inflation-adjusted interest rates. These included data sets such as current price indexes, measures of the economic output gap and various indicators of financial stress. They then compared these 108 datasets to the post-1997 history of TIPS and created a specific mix of those factors (using unique weighings) that could shed light on TIPS’ potential behavior.
This mix, in my opinion, suggests that TIPS will likely maintain a positive relationship with inflation going forward — even in a high-inflation environment.
Using TIPS in a portfolio
Over longer holding periods, the idiosyncratic volatility in TIPS returns has tended to wash out, making the link between TIPS returns and inflation trends more reliable. This can make TIPS a more effective tool for managing inflation risk, though still at the cost of introducing more market risk.
A common question is how to decide whether to hold shorter or longer maturity TIPS. First, it’s important to think about this question in the context of the whole portfolio. Second, remember that TIPS respond in two ways to inflation:
- TIPS income return responds to current inflation: High inflation today increases TIPS interest and principal payments via the inflation accretion formula. Both shorter and longer maturity TIPS benefit equally from inflation accretion.
- TIPS price return responds to changes in inflation expectations: When the market expects higher inflation to persist, future inflation accretion is discounted into TIPS market prices, which rise. Longer maturity TIPS benefit more from this than shorter maturity TIPS, because of their longer duration.
In an inflation shock, it’s the second effect that can generate the “extra” return that may help the whole portfolio. On the other hand, longer maturity TIPS are more volatile, precisely because of their longer duration. We thus end up with the following tradeoff:
- Shorter maturity TIPS protect themselves against inflation, and have moderate market risk.
- Longer maturity TIPS can help hedge the whole portfolio against inflation shocks, but have substantial market risk.
This tradeoff should ideally be managed actively, varying exposure to shorter vs longer maturity TIPS depending on market conditions and changing assessments of risk, and using other tools to manage market risk and inflation risk actively.
Equities can also be a useful hedge against inflation risk over long holding periods, with the benefit of liquidity and ease of inclusion in a traditional portfolio compared to other hedges such as real estate or commodities. While earnings can be adversely affected by short-term inflation shocks, over longer periods of time they have tended to adjust to inflation, as companies have pricing power. Thus, over a sufficiently long period of time, equities have tended to recover from inflation shocks, whereas nominal bonds may not. Equities have substantially more market risk than nominal bonds, so they are not always a suitable inflation hedge on a stand-alone basis. However, even in very conservative portfolios, they can play a useful role alongside TIPS.
To support this thesis, we ran a Monte Carlo simulation1 comparing a nominal bond portfolio (Bloomberg U.S. Aggregate index) with a mix of 80% U.S. TIPS and 20% S&P 500 returns, measuring portfolio longevity in a distribution scenario.2 The simulation paths were divided into three categories based on the long-term rate of inflation seen on each path: Low inflation (lowest 25%, median = 1.2%), moderate inflation (middle 50%, median = 2.4%) and high inflation (highest 25%, median = 3.9%).
For the nominal bond portfolio, the difference in median longevity between the high- and low-inflation paths was 62 months; for the TIPS/equity portfolio, it was only 29 months. In other words, by this measure, the longevity of the TIPS/equity portfolio was only half as sensitive to long-term inflation. This suggests that a mixed TIPS/equity portfolio can provide a more predicable outcome for investors in retirement, regardless of the inflationary environment. Moreover, in the high and medium inflation environments, the TIPS/equity portfolio delivered longer median asset longevity than the nominal bond portfolio (at 268 months vs. 254 months and 285 months vs. 283 months, respectively).
So, while the desire for investors to have a vehicle to insulate themselves from purchasing power loss is nothing new — beginning with Revolutionary War soldiers in 1780 — but has largely been untested in the modern era, there is plenty of evidence suggesting that TIPS may help protect investors should the low rate, low inflation regime truly come to an end.
1 This is a statistical technique that, through a large number of possible scenarios, calculates estimated returns and a range of outcomes that is based on the assumptions included in the analysis. It is provided for informational purposes only, and is not intended to provide any assurance of actual outcomes. The simulation will not capture low-probability, high-impact outcomes. The results of the simulations may be presented in the form of percentiles, reflecting the probability distribution of the portfolio values and statistics. Because of the nature of the analysis, exact replication of the results cannot be guaranteed.
2 In each case, we begin withdrawals at 4% of the initial balance and adjust with inflation. We generate 10,000 Monte Carlo paths using Capital Group’s capital market assumptions, simulate portfolio returns and inflation-adjusted withdrawals, and see how long it takes to exhaust the portfolio along each path.
-
-
Market Volatility
-
World Markets Review
-
Chart in Focus
-
Long-Term Investing
Don’t miss out
Get the Capital Ideas newsletter in your inbox every other week
 Wesley Phoa