U.S. Equities
Portfolio Construction
- Periods of high inflation can affect how different assets perform relative to one another
- The design and management of multi-asset portfolios should account for the impact of inflation on asset class correlations
- Existing analysis and simulation methods can be enhanced to more realistically account for inflation dynamics
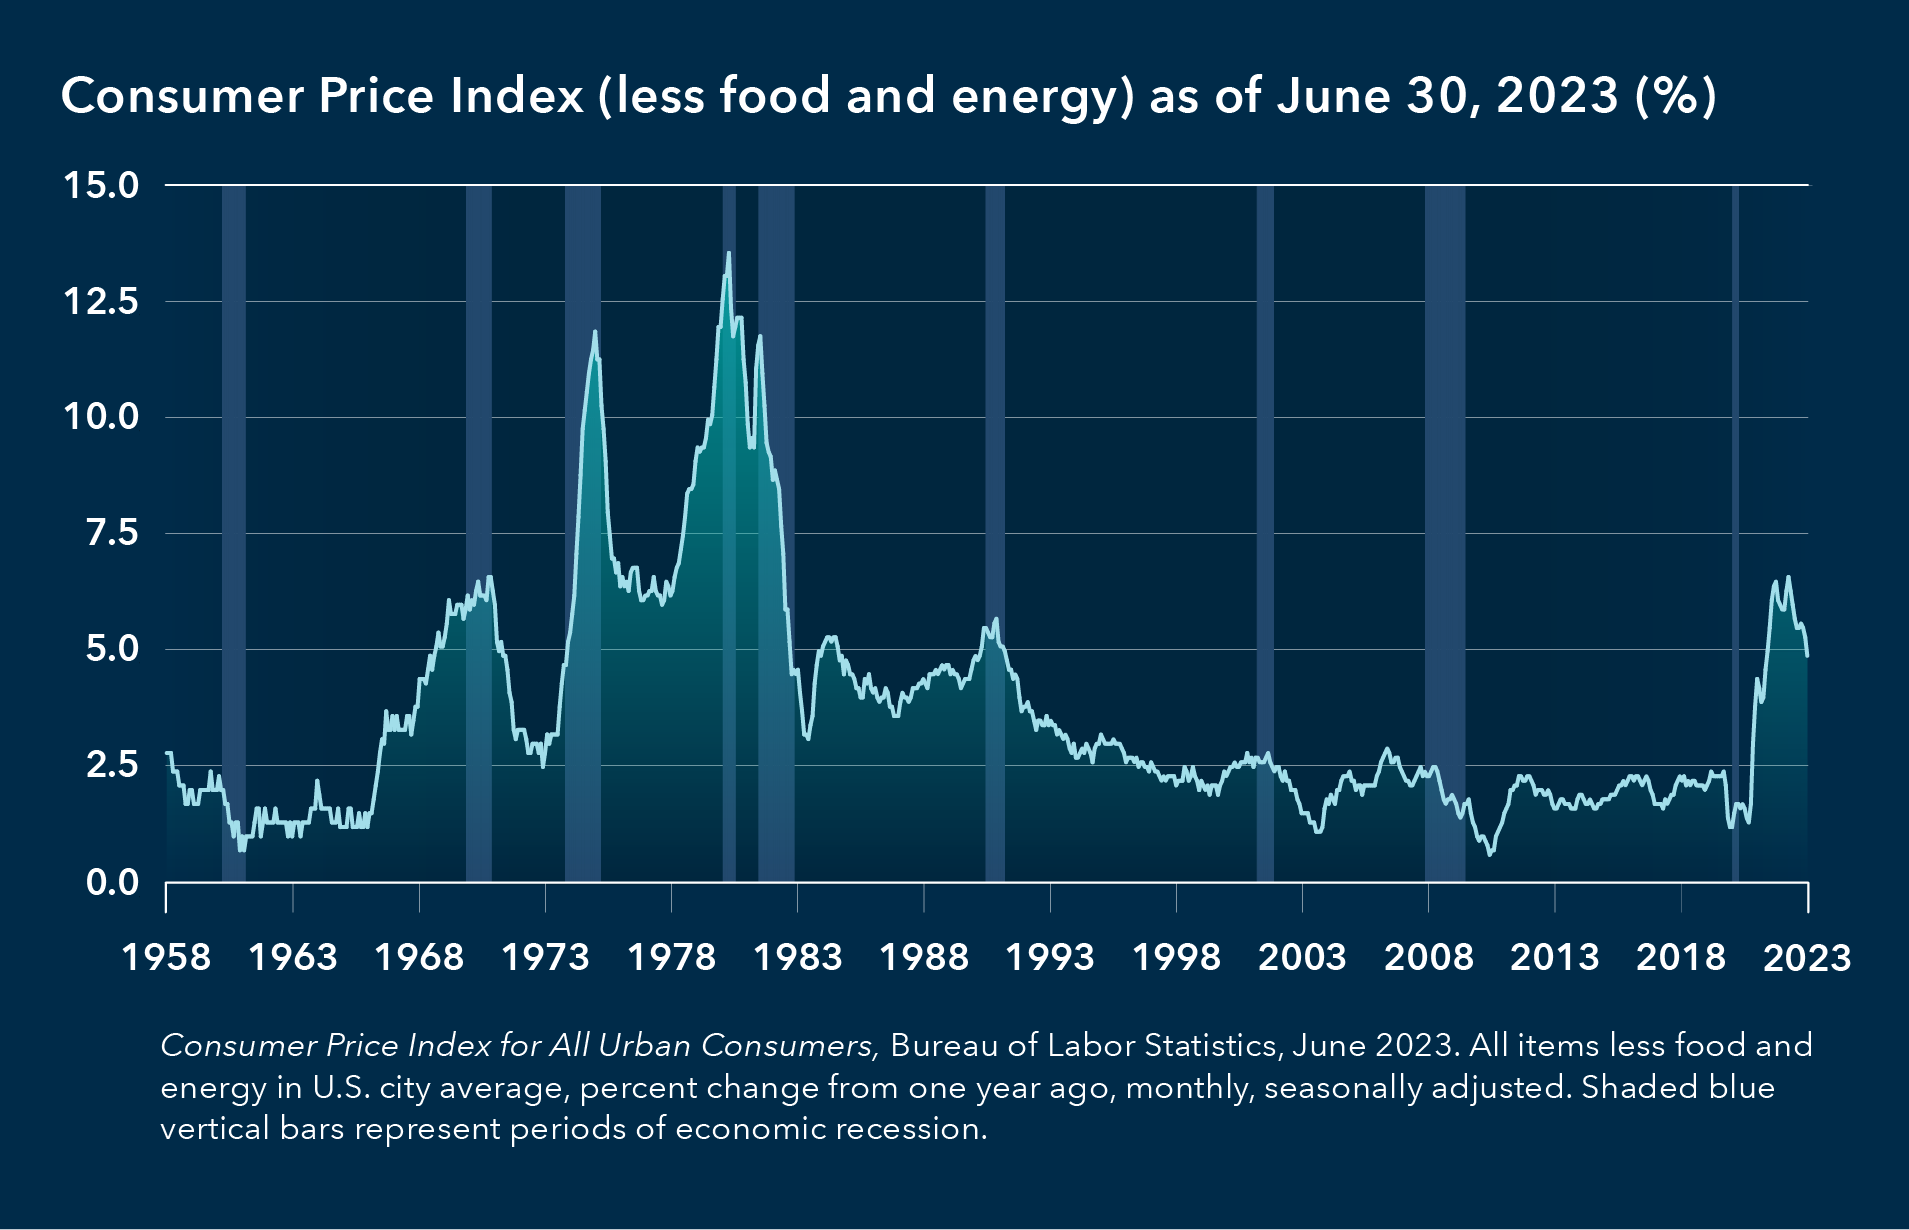
Investors continue to contend with persistently high core inflation, a stark contrast to the era of low and steady inflation rates of recent decades. There are familiar headwinds, especially for portfolios focused on generating real income, as higher inflation eats away at the value of dividends and bond coupons and disrupts asset prices.
But our research highlights an additional threat from higher inflation, one that could result in higher-than-expected portfolio risk via a reduction of diversification benefits.
Inflation doesn’t just jeopardize a portfolio’s ability to generate real returns. It can undermine its ability to mitigate risk as well. Understanding this dynamic is particularly important to more risk-averse investors focused on income and downside protection, such as investors in and near retirement.
High-inflation environments impact how different assets perform relative to each other, as measured by the correlation between stocks and bonds. In normal low-inflation environments, asset returns are primarily affected by growth and flight-to-quality shocks, which have the opposite effect on the prices of stocks and Treasury bonds. But when inflation is high and volatile, inflation shocks dominate, and these can shift stock and bond prices in the same direction.
This behavior should be incorporated into multi-asset portfolio design and management and how practitioners measure the diversification benefits these portfolios offer, especially for those nearing and in retirement.
Inflation dynamics show that the inflation rate follows persistent long-term trends, with considerable volatility over the short term. Moreover, asset class returns and inflation jointly exhibit persistent regimes, where both the average rate of inflation and the correlation among asset class returns shift together.
Asset correlations are a key input into portfolio construction. Therefore, in constructing portfolios with inflation risk in mind — and understanding how they may respond to changes in the long-term inflation regime — it is important to take these dynamics into account, for example when running Monte Carlo simulations.1

Source: Bureau of Labor Statistics. Shaded dark blue vertical bars represent periods of economic recession.
Based on observed historical data, a simple rule of thumb can connect the inflation trend to the stock-bond correlation regime: When medium-term trend inflation rises above 4% (as it did in 2022), stock-bond correlations tend to turn positive; when trend inflation falls below 2.5%, correlations tend to revert to negative.2
Another difficulty with sampling asset returns from static capital market assumptions is related to returns on cash. Cash yields tend to be higher in a high-inflation regime and lower in a low-inflation regime.3 Portfolio analysis and simulation should reflect this.
Multi-asset portfolios constructed and managed using static correlation assumptions may not be properly structured given these findings.4 This can result in suboptimal allocations that may not achieve desired portfolio objectives.
Practitioners should seek to develop a joint model of asset class returns, inflation, cash yields and correlation regimes. The integration needs to account for several key features:
- Monte Carlo simulations should explicitly incorporate inflation. Along each path, the rate of inflation should evolve dynamically and be appropriately linked to asset returns (e.g., when inflation rises, bonds do poorly).
- The inflation rate and the yield on cash should be modeled as random walks, rather than as white noise as is done for other asset classes.5
- Simulations should allow for regime-switching behavior.
- Expected asset class returns and correlations should be appropriate for the inflation regime being modeled. This can be achieved by formulating regime-specific capital market assumptions.
These features can be retrofitted onto an existing simulation engine to help it realistically account for how inflation may impact asset classes. Incorporating realistic inflation dynamics leads to changes in insights regarding both asset allocations and the potential distribution of outcomes. The approach presented here is already proving useful in the management of our multi-asset solutions.
Learn more about Capital Group’s approach to inflation risk in our white paper “How our Target Date Series manages inflation risk.”
1 Monte Carlo simulation is a mathematical technique that generates random numbers to estimate the range of possible outcomes for an uncertain event.
2 For details on all aspects of the modeling approaches, refer to Phoa, Wesley K., “Strategic Asset Allocation and Inflation Resilience,” Journal of Portfolio Management, March 2023.
3 Cash yield refers to the income generated by an investment (i.e., interest, bond coupons or stock dividends), which excludes capital appreciation.
4 A static correlation assumption applies a single estimate of asset class correlations across a long-term horizon.
5 A random walk represents changes in a variable that follow no discernable trend. White noise refers to variations in data that do not exhibit causal relationships with any other variables.
Our latest insights
-
-
Global Equities
-
Economic Indicators
-
-
RELATED INSIGHTS
-
Asset Allocation
-
Market Volatility
-
Target Date
Never miss an insight
The Capital Ideas newsletter delivers weekly insights straight to your inbox.
 Wesley Phoa
 Steve Fox