Portfolio Construction
Risk management is critical to portfolio construction, as this year’s choppy markets have highlighted.
Some investors may think the best way to offset market volatility is with significant portfolio changes. But we’ve found that aggressive short-term moves, whether “buying the dip” of beaten down investments or shifting to very conservative holdings to ride out a market storm, often lead to even more unintended risks.
Equities are typically the riskiest part of a portfolio, but not all equity funds are created equal. To find out which strategies can help you weather down markets, we’ve examined results for virtually every equity mutual fund since 1934. Our research identified common traits of resilient funds, some of which can help manage risk, enhance outcomes and more closely align funds with clients’ objectives.
Here are three ways to help prepare your portfolio for down markets:
1. Look for a history of downside resilience
Despite evidence that market timing doesn’t work, investors still want to protect their assets. “Loss aversion,” the behavioral finance concept that claims investors dislike losses twice as much as they appreciate gains, helps explain this mindset. Partly responsible for Daniel Kahneman’s 2002 Nobel Prize, it is also a fancy way of saying investors hate to lose money.
This year’s market volatility has renewed interest in finding ways to mitigate portfolio losses. But what’s the best way to achieve this?
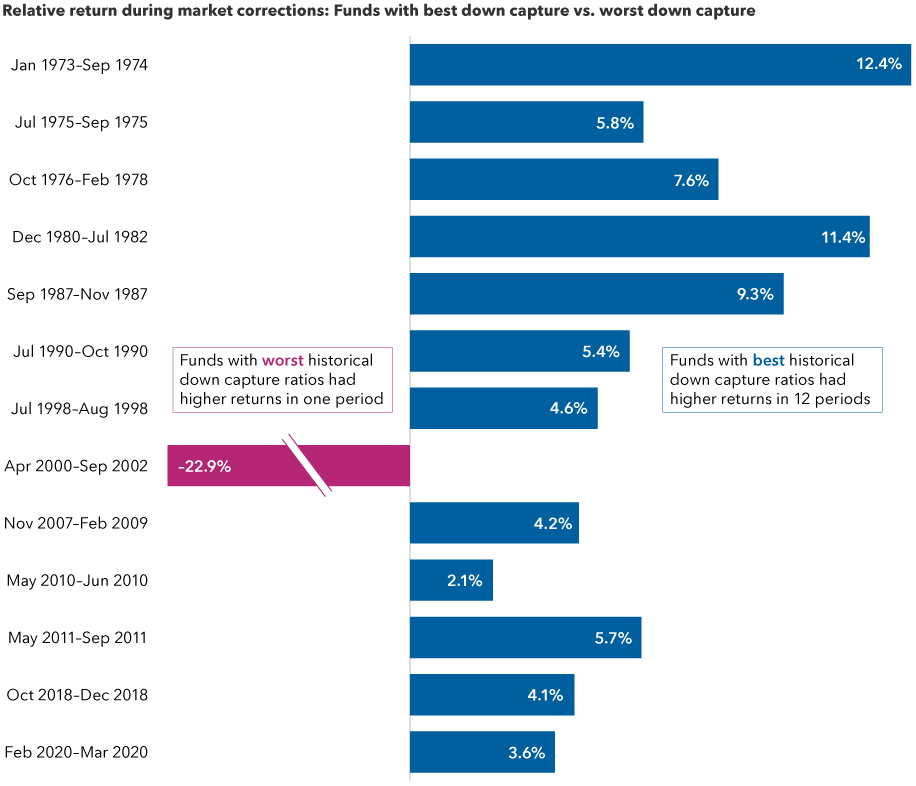
Our study revealed that downside capture — a measure of a fund’s results relative to a benchmark in negative market periods — has been an indicator of potential success in future downturns. Notably, funds with low downside capture ratios in the previous three years outpaced their peers in future corrections and bear markets in 12 of the 13 periods since 1973.
Funds with strong downside capture ratios typically outpaced peers in future downturns

Sources: Capital Group, Morningstar, Standard & Poor's. Funds were grouped into downside capture ratio quartiles based on three-year downside capture ratios in the month prior to the start of a market correction (S&P 500 decline of 10% or more). Returns shown in the chart are the relative returns of the best down capture quartile minus the returns for the worst down capture quartile during the next market correction. Funds include those from the Morningstar Open-End Large Growth, Large Value and Large Blend categories. All data reflect month-end dates. As of 6/30/22, the current market correction is still ongoing and is not included in the analysis.
2. Optimize your portfolio with all-weather investments
Downside protection may be some investors’ top objective, but for most it likely isn’t enough. After all, cash will offer a measure of protection in the next downturn — albeit with virtually no upside during a market recovery.
What many investors want is downside protection that also participates in market upside — an “all-weather” portfolio. A more technical term for this would be positive asymmetric risk and returns, which is an investment opportunity that’s favorably unbalanced toward the upside. This could mean the potential profit is higher than potential loss, or the probability of a gain is higher than the probability of a similar-sized loss.
We’ve identified three traits most common among funds that have exhibited strong outcomes across full cycles:
Active — By definition, a passive fund’s primary goal is to replicate a chosen index’s returns, including 100% upside and 100% downside capture. In contrast, active funds can seek to manage risk through security selection, though they may lag the index. Active management can also incorporate secondary client objectives, such as income or capital preservation, in addition to growth. We found that some of the most successful managers were those that incorporated multiple client objectives into the fund prospectus and strategy.
Flexible — Funds that incorporated some flexibility versus traditional style box metrics on size, style or geography had a larger set of stocks to choose from and could optimize based on market conditions. A flexible fund that shifts between the full universe of growth and value stocks has the potential for better outcomes than making a timing bet and aggressively buying or selling assets.
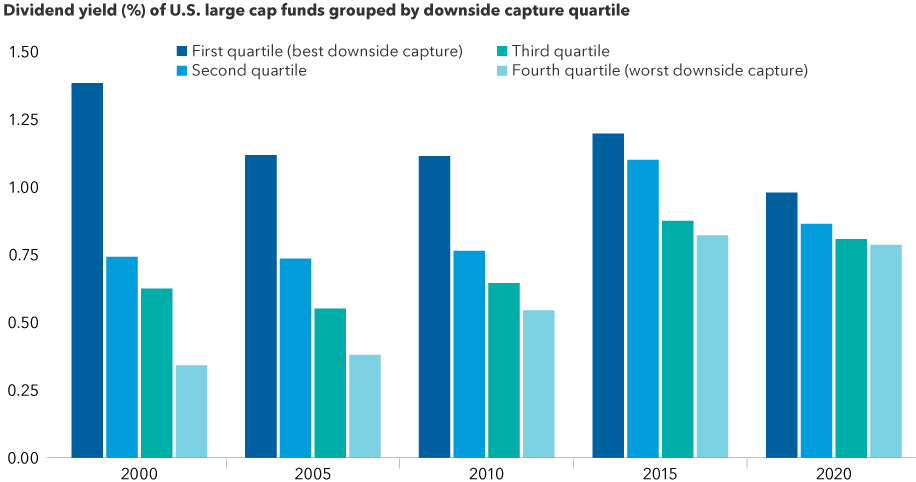
High yielding — These funds often had higher dividend yields than peers. In an analysis of monthly returns since 1993, funds with the best downside resilience (an average down capture ratio of 85%) had a higher dividend yield than their peers in all periods measured. There was a notable decrease in downside protection with lower yielding funds.
Higher dividend yields have contributed to better downside resilience

Source: Capital Group, based on data from Morningstar. Funds include those from the Morningstar Open-End Large Growth, Large Value and Large Blend categories. Downside capture quartiles calculated using three-year down capture ratios compared to the S&P 500 Index.
The asymmetry of gains and losses over time can be quite powerful. Managers who deliver on this trait can achieve a few potential benefits: 1) higher returns, as smaller losses allow for quicker compounding in the next leg up in the cycle; 2) lower volatility, as the highest peaks and deepest valleys are somewhat truncated; and 3) more patient clients, who are likely to stay the course through future market cycles.
3. Consider funds with high overall capture ratios
One way to assess asymmetric risk is to examine an investment’s overall capture ratio — a measure that divides upside capture by downside capture.
There are many funds that may have slightly lagged the benchmark in extended positive periods, but their strong avoidance of loss in negative periods has offered an asymmetric advantage.
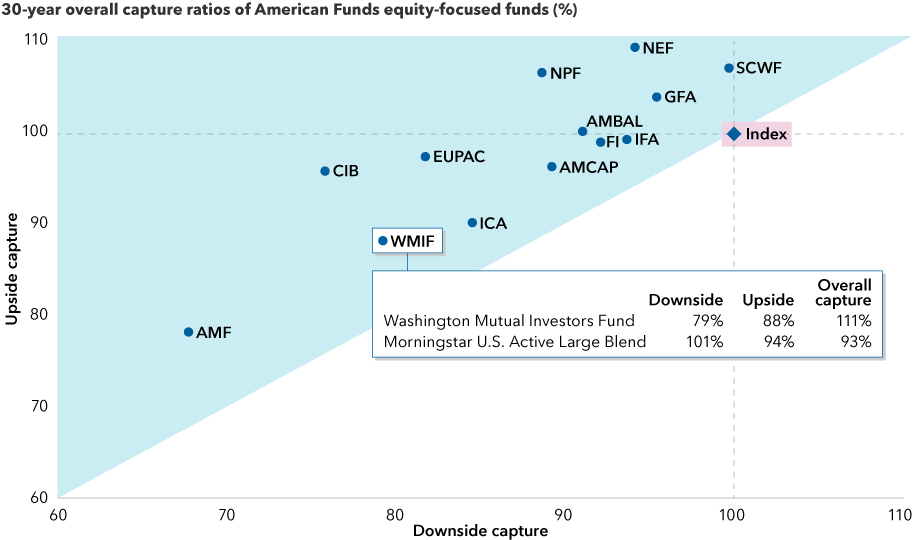
The pursuit of downside resilience is built into Capital Group’s long-term focus and investment philosophy. Over the last 30 years, every fund in our equity lineup with at least a 30-year history has had an overall capture ratio of over 100% — meaning its upside capture ratio has been higher than its downside capture ratio. Additionally, during this period, each of these funds has also achieved lower downside capture than the market. Evaluating the full spectrum of funds across this risk dimension allows investors to choose a more appropriate fund for their investment objectives.
Capital Group’s equity funds have had positive overall capture ratios

Sources: Capital Group, Morningstar. As of 12/31/21. The shaded blue area represents an overall capture ratio over 100% (which occurs when upside capture ratio is above downside capture ratio). Funds without a 30-year history were excluded from analysis. Please see disclosures below for full names of the funds and benchmarks used to calculate the capture ratios included in the chart.
For example, Washington Mutual Investors FundSM has an upside capture of 88% and a downside capture ratio of 79% over the last 30 years. For investors who use separately managed accounts in their portfolios, Capital Group U.S. Income and GrowthSM SMA is a strategy that also emphasizes downside resilience. This type of asymmetry can add value over a full market cycle and give investors more confidence to avoid bad timing decisions.
By examining the risk-return frontier, objective-based strategies such as these can help fine-tune risk and the amount of potential downside protection. Taken together, these characteristics may offer exactly what most clients are looking for: reasonable participation in market upsides combined with lower downside capture potential in inevitable market declines.
Investing outside the United States involves risks, such as currency fluctuations, periods of illiquidity and price volatility, as more fully described in the prospectus. These risks may be heightened in connection with investments in developing countries. Small-company stocks entail additional risks, and they can fluctuate in price more than larger company stocks.
The market indexes are unmanaged and, therefore, have no expenses. Investors cannot invest directly in an index.
In the overall capture ratio chart, the S&P 500 Index was used as the comparative benchmark for capture ratio calculations for the following funds: AMCAP Fund® (AMCAP), American Mutual Fund® (AMF), The Growth Fund of America® (GFA), Fundamental Investors® (FI), The Investment Company of America® (ICA), Washington Mutual Investors FundSM (WMIF). MSCI ACWI was used for the following funds: The New Economy Fund® (NEF), New Perspective Fund® (NPF). MSCI ACWI ex USA was used for EuroPacific Growth Fund® (EUPAC). MSCI ACWI Small Cap was used for SMALLCAP World Fund® (SCWF). 70% MSCI ACWI/30% Bloomberg U.S. Aggregate Index blend was used for Capital Income Builder® (CIB). 65% S&P 500/35% Bloomberg U.S. Aggregate Index blend was used for The Income Fund of America® (IFA). 60% S&P 500/40% Bloomberg U.S. Aggregate Index blend was used for American Balanced Fund® (AMBAL).
Up (down) capture ratio is the ratio of a fund’s return during periods when the index was up (down), divided by the return of the index during those periods. For example, an up-capture ratio greater than 100 indicates the fund produced a higher return than the index during periods when the index was up. Conversely, during periods when the index was down, a down-capture ratio greater than 100 indicates the fund produced a lower return than the index.
©2022 Morningstar, Inc. All rights reserved. The information contained herein: (1) is proprietary to Morningstar and/or its content providers; (2) may not be copied or distributed; and (3) is not warranted to be accurate, complete or timely. Neither Morningstar nor its content providers are responsible for any damages or losses arising from any use of this information. Past performance is no guarantee of future results.
S&P 500 Index is a market capitalization-weighted index based on the results of approximately 500 widely held common stocks.
S&P 500 (“Index”) is a product of S&P Dow Jones Indices LLC and/or its affiliates and has been licensed for use by Capital Group. Copyright © 2022 S&P Dow Jones Indices LLC, a division of S&P Global, and/or its affiliates. All rights reserved. Redistribution or reproduction in whole or in part is prohibited without written permission of S&P Dow Jones Indices LLC.
Our latest insights
-
-
Emerging Markets
-
Global Equities
-
Economic Indicators
-
Don’t miss out
Get the Capital Ideas newsletter in your inbox every other week
 Steve Deschenes