MARKET VOLATILITY

Navigating markets and volatility

Resources, insights and support to guide you

Market insights and analysis

Timely and actionable insights to help you make sense of the markets and guide your investment decisions

Investment results

See how our mutual funds are doing, including current results for all our different fund types.

See how our mutual funds are doing, including current results for all our different fund types

Experience matters

Throughout our history, we've weathered past storms. In fact, our equity-focused funds have outpaced their benchmark indexes during the biggest downturns of the last nine decades.

Across 17 bear markets, the equity-focused American Funds outpaced their benchmarks 77% of the time.
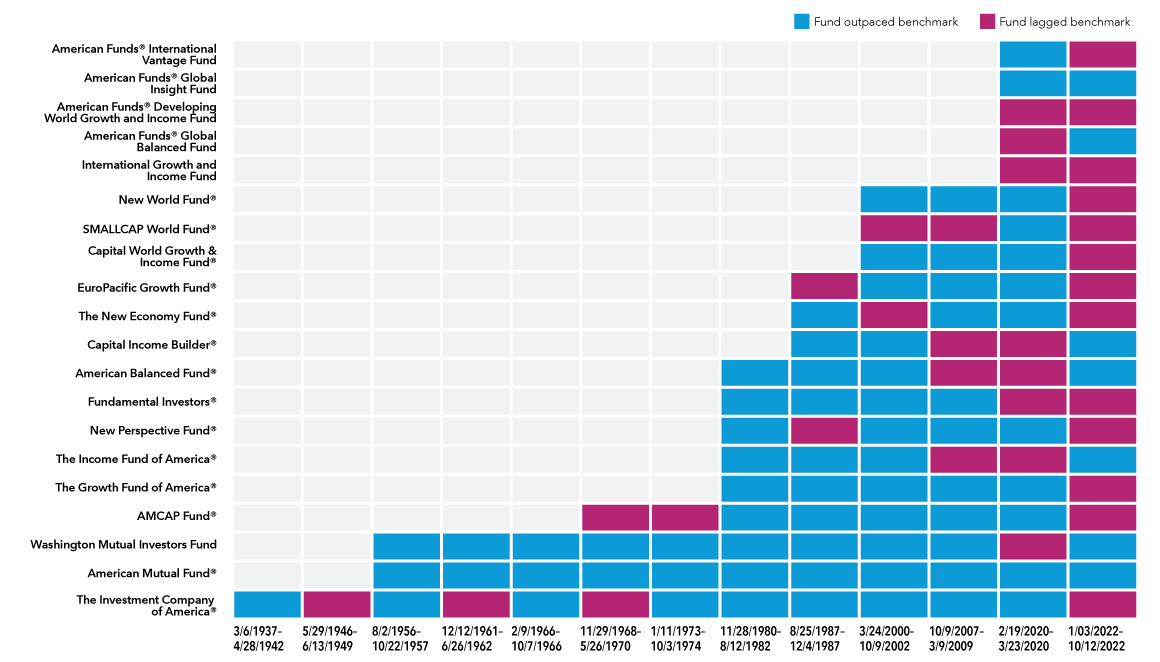
Chart has legend of two squares. Blue square labeled: Fund outpaced benchmark. Raspberry square labeled: Fund lagged benchmark. The chart tracks performance of 20 equity-focused American Funds through bear markets since each fund's inception. There are a total of 13 bear-market periods shown on the chart, with fund performance listed by the age of each fund. During the 3/6/1937—4/28/1942 bear market, The Investment Company of America outpaced its benchmark, but it lagged its benchmark during the 5/29/1946—6/13/1949 bear market. During the 8/2/1956—10/22/1957 bear market, The Investment Company of America, American Mutual Fund and Washington Mutual Investors Fund outpaced their benchmarks. During the 12/12/1961—6/26/1962 bear market, American Mutual Fund and Washington Mutual Investors Fund outpaced their benchmarks, while The Investment Company of America lagged its benchmark. During the 2/9/1966—10/7/1966 bear market, all three of the aforementioned funds outpaced their benchmarks. During the 11/29/1968—5/26/1970 bear market, American Mutual Fund and Washington Mutual Investors Fund outpaced their benchmarks, while The Investment Company of America and AMCAP Fund lagged their benchmarks. During the 1/11/1973—10/3/1974 bear market, The Investment Company of America, American Mutual Fund and Washington Mutual Investors Fund outpaced their benchmarks, while AMCAP Fund lagged its benchmark. During the 11/28/1980—8/12/1982 bear market, The Investment Company of America, American Mutual Fund, Washington Mutual Investors Fund, AMCAP Fund, The Growth Fund of America, The Income Fund of America, New Perspective Fund, Fundamental Investors and American Balanced Fund outpaced their benchmarks. During the 8/25/1987—12/4/1987 bear market, The Investment Company of America, American Mutual Fund, Washington Mutual Investors Fund, AMCAP Fund, The Growth Fund of America, The Income Fund of America, Fundamental Investors, American Balanced Fund, Capital Income Builder and The New Economy Fund outpaced their benchmarks, while New Perspective Fund and EuroPacific Growth Fund lagged their benchmarks. During the 3/24/2000—10/9/2002 bear market, The Investment Company of America, American Mutual Fund, Washington Mutual Investors Fund, AMCAP Fund, The Growth Fund of America, The Income Fund of America, New Perspective Fund, Fundamental Investors, American Balanced Fund, Capital Income Builder, EuroPacific Growth Fund, Capital World Growth & Income Fund and New World Fund outpaced their benchmarks, while The New Economy Fund and SMALLCAP World Fund lagged their benchmarks. During the 10/9/2007—3/9/2009 bear market, The Investment Company of America, American Mutual Fund, Washington Mutual Investors Fund, AMCAP Fund, The Growth Fund of America, New Perspective Fund, Fundamental Investors, The New Economy Fund, EuroPacific Growth Fund, Capital World Growth & Income Fund and New World Fund outpaced their benchmarks, while The Income Fund of America, American Balanced Fund, Capital Income Builder and SMALLCAP World Fund lagged their benchmarks. During the 2/19/2020—3/23/2020 bear market, The Investment Company of America, American Mutual Fund, AMCAP Fund, The Growth Fund of America, New Perspective Fund, The New Economy Fund, EuroPacific Growth Fund, Capital World Growth & Income Fund, SMALLCAP World Fund, New World Fund, American Funds Global Insight Fund and American Funds International Vantage Fund outpaced their benchmarks, while Washington Mutual Investors Fund, The Income Fund of America, Fundamental Investors, American Balanced Fund, Capital Income Builder, International Growth and Income Fund, American Funds Global Balanced Fund and American Funds Developing World Growth and Income Fund lagged their benchmarks. During the 01/03/2022—10/12/2022 bear market, American Mutual Fund, Washington Mutual Investors Fund, The Income Fund of America, American Balanced Fund, Capital Income Builder, American Funds Global Balanced Fund and American Funds Global Insight Fund outpaced their benchmarks, while The Investment Company of America, AMCAP Fund, The Growth Fund of America, New Perspective Fund, Fundamental Investors, The New Economy Fund, EuroPacific Growth Fund, Capital World Growth & Income Fund, SMALLCAP World Fund, New World Fund,International Growth and Income Fund, American Funds Developing World Growth and American Funds International Vantage Fund lagged their benchmarks.

Experience matters

Throughout our history, we've weathered storms. In fact, our equity-focused funds have outpaced their benchmark indexes during the biggest downturns of the last nine decades.

Across 13 bear markets, the equity-focused American Funds outpaced their benchmarks 69% of the time.

Sources: Capital Group, Morningstar. Class F-2 shares with all distributions reinvested. View fund expense ratios and returns.

Dates shown for bear markets are based on price declines of 20% or more (without dividends reinvested) in the unmanaged S&P 500 with 100% recovery between declines. Funds shown are the equity-focused American Funds in existence at the time of each decline. Fund and benchmark returns are based on total returns. 

Class F-2 shares were first offered on August 1, 2008. Class F-2 share results prior to the date of first sale are hypothetical based on Class A share results without a sales charge, adjusted for estimated annual expenses. The results shown are before taxes on fund distributions and sale of fund shares. Past results are not predictive of results in future periods. Results for other share classes may differ.

Benchmark indexes for the funds: S&P 500 (The Investment Company of America, American Mutual Fund, Washington Mutual Investors Fund, AMCAP Fund, The Growth Fund of America, American Funds Fundamental Investors); MSCI World (New Perspective Fund, Capital World Growth and Income Fund, American Funds Global Insight Fund); 60% S&P 500 / 40% Bloomberg U.S. Aggregate (American Balanced Fund); 65% S&P 500 / 35% Bloomberg U.S. Aggregate (The Income Fund of America); 70% MSCI ACWI / 30% Bloomberg U.S. Aggregate (Capital Income Builder); S&P 500 prior to the 2020 bear market, MSCI ACWI thereafter (The New Economy Fund); MSCI EAFE prior to the 2007-09 bear market, MSCI ACWI ex USA thereafter (EuroPacific Growth Fund); MSCI All Country World Small Cap (SMALLCAP World Fund); MSCI ACWI (New World Fund); MSCI ACWI ex USA (International Growth and Income Fund), 60% MSCI ACWI / 40% Bloomberg Global Aggregate (American Funds Global Balanced Fund); MSCI Emerging Markets (American Funds Developing World Growth and Income Fund); MSCI EAFE (American Funds International Vantage Fund).

Support

These resources can help you maintain your financial plan no matter how the market behaves

S&P 500 Index is a market capitalization-weighted index based on the results of approximately 500 widely held common stocks. 

Bloomberg U.S. Aggregate Index represents the U.S. investment-grade fixed-rate bond market. Bloomberg Global Aggregate Index represents the global investment-grade fixed income markets. 

MSCI World Index is a free float-adjusted market capitalization weighted index that is designed to measure equity market results of developed markets. The index consists of more than 20 developed market country indexes, including the United States. Results reflect dividends net of withholding taxes. MSCI All Country World Index is a free float-adjusted market capitalization weighted index that is designed to measure equity market results in the global developed and emerging markets, consisting of more than 40 developed and emerging market country indexes. Results reflect dividends gross of withholding taxes through December 31, 2000, and dividends net of withholding taxes thereafter. MSCI EAFE® (Europe, Australasia, Far East) Index is a free float-adjusted market capitalization weighted index that is designed to measure developed equity market results, excluding the United States and Canada. Results reflect dividends net of withholding taxes. MSCI All Country World ex USA Index is a free float-adjusted market capitalization weighted index that is designed to measure equity market results in the global developed and emerging markets, excluding the United States. The index consists of more than 40 developed and emerging market country indexes. Results reflect dividends gross of withholding taxes through December 31, 2000, and dividends net of withholding taxes thereafter. MSCI All Country World Small Cap Index is a free float-adjusted market capitalization-weighted index that is designed to measure equity market results of smaller capitalization companies in both developed and emerging markets. Results reflect dividends net of withholding taxes. MSCI Emerging Markets Index is a free float-adjusted market capitalization weighted index that is designed to measure equity market results in the global emerging markets, consisting of more than 20 emerging market country indexes. Results reflect dividends gross of withholding taxes through December 31, 2000, and dividends net of withholding taxes thereafter. 

These indexes are unmanaged, and their results include reinvested dividends and/or distributions but do not reflect the effect of sales charges, commissions, account fees, expenses or U.S. federal income taxes.

Investments are not FDIC-insured, nor are they deposits of or guaranteed by a bank or any other entity, so they may lose value.
Investors should carefully consider investment objectives, risks, charges and expenses. This and other important information is contained in the fund prospectuses and summary prospectuses, which can be obtained from a financial professional and should be read carefully before investing.
Lower rated bonds are subject to greater fluctuations in value and risk of loss of income and principal than higher rated bonds.
The return of principal for bond portfolios and for portfolios with significant underlying bond holdings is not guaranteed. Investments are subject to the same interest rate, inflation and credit risks associated with the underlying bond holdings.
Investing outside the United States involves risks, such as currency fluctuations, periods of illiquidity and price volatility. These risks may be heightened in connection with investments in developing countries.
Smaller company stocks entail additional risks, and they can fluctuate in price more than larger company stocks.
There have been periods when the results lagged the index(es) and/or average(s). The indexes are unmanaged and, therefore, have no expenses. Investors cannot invest directly in an index.
MSCI has not approved, reviewed or produced this report, makes no express or implied warranties or representations and is not liable whatsoever for any data in the report. You may not redistribute the MSCI data or use it as a basis for other indices or investment products.
Source: Bloomberg Index Services Limited. BLOOMBERG® is a trademark and service mark of Bloomberg Finance L.P. and its affiliates (collectively "Bloomberg"). Bloomberg or Bloomberg's licensors own all proprietary rights in the Bloomberg Indices. Neither Bloomberg nor Bloomberg's licensors approves or endorses this material, or guarantees the accuracy or completeness of any information herein, or makes any warranty, express or implied, as to the results to be obtained therefrom and, to the maximum extent allowed by law, neither shall have any liability or responsibility for injury or damages arising in connection therewith.
Each S&P Index ("Index") shown is a product of S&P Dow Jones Indices LLC and/or its affiliates and has been licensed for use by Capital Group. Copyright © 2024 S&P Dow Jones Indices LLC, a division of S&P Global, and/or its affiliates. All rights reserved. Redistribution or reproduction in whole or in part is prohibited without written permission of S&P Dow Jones Indices LLC.
All Capital Group trademarks mentioned are owned by The Capital Group Companies, Inc., an affiliated company or fund. All other company and product names mentioned are the property of their respective companies.
Use of this website is intended for U.S. residents only.
Capital Client Group, Inc.
This content, developed by Capital Group, home of American Funds, should not be used as a primary basis for investment decisions and is not intended to serve as impartial investment or fiduciary advice.
© 2024 Morningstar, Inc. All Rights Reserved. Some of the information contained herein: (1) is proprietary to Morningstar and/or its content providers; (2) may not be copied or distributed; and (3) is not warranted to be accurate, complete or timely. Neither Morningstar, its content providers nor Capital Group are responsible for any damages or losses arising from any use of this information. Past performance is no guarantee of future results. Information is calculated by Morningstar. Due to differing calculation methods, the figures shown here may differ from those calculated by Capital Group.