In observance of the Christmas Day federal holiday, the New York Stock Exchange and Capital Group’s U.S. offices will close early on Wednesday, December 24 and will be closed on Thursday, December 25. On December 24, the New York Stock Exchange (NYSE) will close at 1 p.m. (ET) and our service centers will close at 2 p.m. (ET)
Rethink how you think about risk
Risk is more complex than a down market. One of the biggest risks is that you won’t reach your goal or won’t reach it within your time frame. That’s why time horizon — how long your investment has to grow — is also a factor in determining the right level of risk for your portfolio. The shorter your investment time horizon, the greater the risk of loss on your investment.
How much time do you have to invest?
-
-
1–10 years
Just around the corner
You might not even have a goal; you may just want your cash to work harder. Either way, it takes time for investments to grow, and investments can lose value.
If you have only a few years, you might consider a short-term fund, such as a money market fund or a short-term bond fund. With closer to 10 years, a balanced fund may be worth considering.
-
10–20 years
In the future
Use asset allocation — spreading your investment across several types of stock and bond funds — to hit your risk-reward sweet spot.
Consider looking for funds that invest in dividend-paying stocks, such as an equity-income fund or a growth-and-income fund, as the dividend income can help provide a cushion in volatile markets. As you're exploring, you'll want to read each fund's investment objectives and strategies. For example, two different growth-and-income funds might have two different investment objectives and strategies.
-
20+ years
The next stage in life
With a long time horizon, you may be able to take on more risk with investments that offer long-term growth. Focus on growing your assets, as long as you’re willing to ride out the market’s inevitable ups and downs.
Consider a growth fund as a core portfolio investment.
-
The risk of avoiding risk
When markets decline, it can be tempting to pull your money out until things calm down. But that could be a mistake. Even if you sell early in a downturn, it’s impossible to know the right time to get back in.
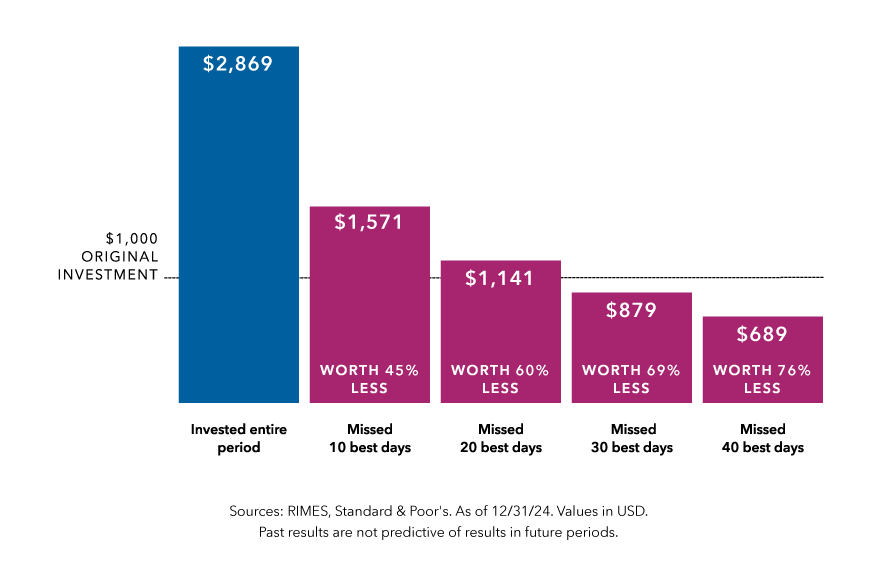
The chart to the right compares the returns of a hypothetical investment of $1,000 in the S&P 500 Index from 2014 to 2024. Investors who remained steadily invested would have seen their $1,000 investment more than double in value, growing to $2,869. However, investors who missed 40 of the best days during that period could see their investment top out at $689 — 76% less.
The lesson: Focus on time in the market, not timing the market.

S&P 500 Index is a market capitalization-weighted index based on the results of approximately 500 widely held common stocks. This index is unmanaged, and its results include reinvested dividends and/or distributions but do not reflect the effect of sales charges, commissions, account fees, expenses or U.S. federal income taxes.