Portfolio Construction
The fastest stock market decline in history, global supply chain disruptions, record U.S. unemployment, social distancing, widespread civil protests — the year is only half over and already one for the books. Whether you believe the worst is past or you’re waiting for the other shoe to drop, even the most diligent long-term investors may be wondering what’s going to happen next and what, if anything, to do about it now.
“What you don’t want to do is abandon the market and move everything to cash,” according to Cameron Zokaei, a portfolio consultant with Capital Group. The market’s speedy rebound is proof that time, not timing, matters most when it comes to investing. Leave the market entirely and you risk missing out on any potential recovery.
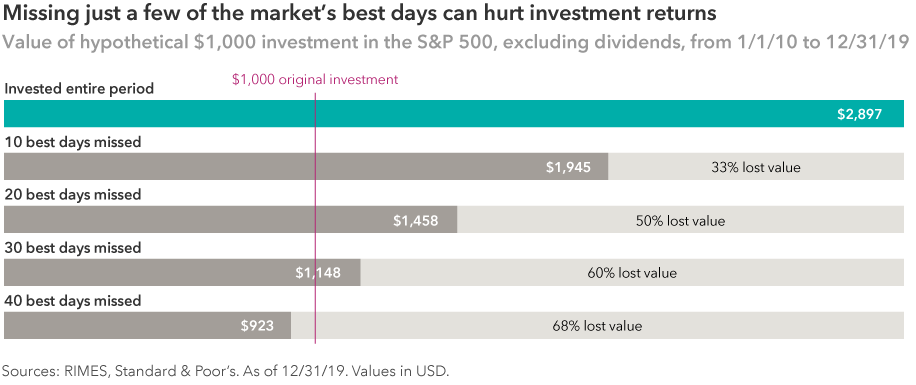
Consider an example of a hypothetical “buy and hold” investor who got into the market in January 2010 and stayed put for 10 years, compared to investors who moved in and out of the market over the same period. Missing out on even the 10 best days would have significantly impacted your long-term returns.

But the logic of this example may fall on deaf ears with investors who have been emotionally shaken by this year’s volatility.
So what can investors do now? Whether you’re nervous, optimistic about new opportunities or somewhere in the middle, here are four portfolio moves to consider for the rest of 2020.
1. Make sure your bond portfolio is positioned to hold up when stocks go down
Dips in stock prices may or may not have you reconsidering risk, but they can be a reminder of the important role bonds can play in adding diversification and capital preservation to a portfolio.
Not all bond strategies are alike, however, says Zokaei. “Investors who bought lower quality issues as a source of income may have been shocked this year to experience a drop in their bond portfolios just when they needed resilience most.” He adds, “It’s still a good time to review your fixed income investments to make sure you’re holding high-quality core bonds, which can add balance to an equity portfolio.”
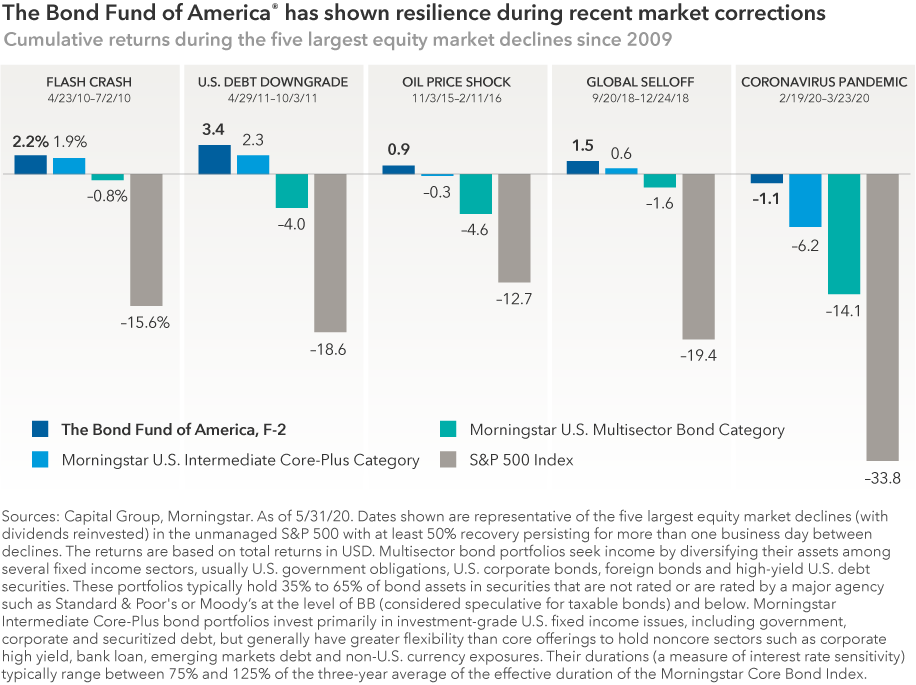
One example of an intermediate term core bond fund managed with a focus on quality is The Bond Fund of America®. Its managers attempt to offset equity risk by investing primarily in U.S. issues rated BBB+ or higher, with no more than 10% of fund assets invested in issues rated below Ba1 or BB+. This discipline has helped the fund provide ballast when stock markets declined. During the past five largest market corrections, The Bond Fund of America outpaced the performance of the average U.S. multisector bond fund as well as the average core-plus fund in the U.S. intermediate bond category.
Figures shown are past results for F-2 shares and are not predictive of results in future periods. Current and future results may be lower or higher than those shown. Prices and returns will vary, so investors may lose money. Investing for short periods makes losses more likely. For current information and month-end results, view fund expense ratios and returns.

2. Look for equities that aren’t as volatile as the index
Even if the stock market has returned to pre-pandemic levels, some investors may still be smarting from the volatility. To help dampen the impact of future market swings, consider the quality of your underlying equities.
“During times of uncertainty, it’s a good idea to hold well-managed companies — those with low debt, cash on hand and investment-grade credit ratings. They have typically been in a better position to withstand extreme market downturns,” explains Zokaei.
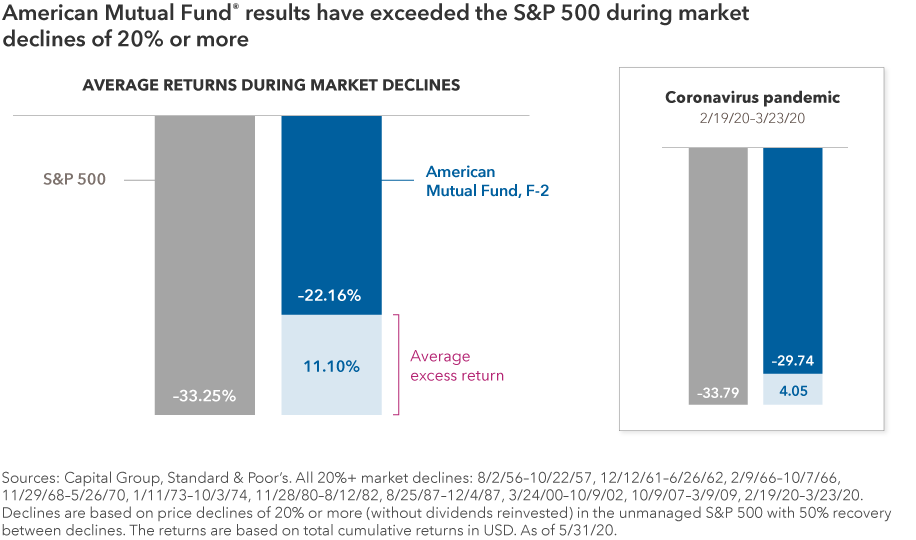
One fund that concentrates on such companies is American Mutual Fund®, an equity fund managed for conservative growth and income. Its focus on solid, dividend-paying companies has helped American Mutual generate an average excess return of 11.1% over the average return of the Standard & Poor’s 500 Composite Index during the 10 bear markets that have occurred since the fund’s inception in 1950.

3. Expand your horizons by thinking beyond borders through flexible strategies
For some investors, the biggest concern is market FOMO: fear of missing out on post-pandemic buying opportunities. For example, there may be great potential upside in international equities as the world economy comes back online after the shutdown.
There is a large pool from which to select attractively priced stocks of well-managed companies outside of the U.S. While international equities have lagged the performance of the S&P 500 Index in recent years, the world’s top-performing stocks are increasingly from companies located outside the U.S.
The potential for success in this asset class is helped by having boots on the ground, conducting extensive research and relying on experienced managers with an in-depth understanding of companies and regions across the globe.
Investors may want to consider funds with flexible mandates that allow their managers to choose from the best companies, no matter where they are located. For example, New Perspective Fund® is a flexible fund that invests in growing multinational companies with sound management teams and sustainable advantages all over the world. The fund’s managers and investment analysts research companies around the globe, and the portfolio included investments in 292 companies based in 28 countries as of January 31, 2020.

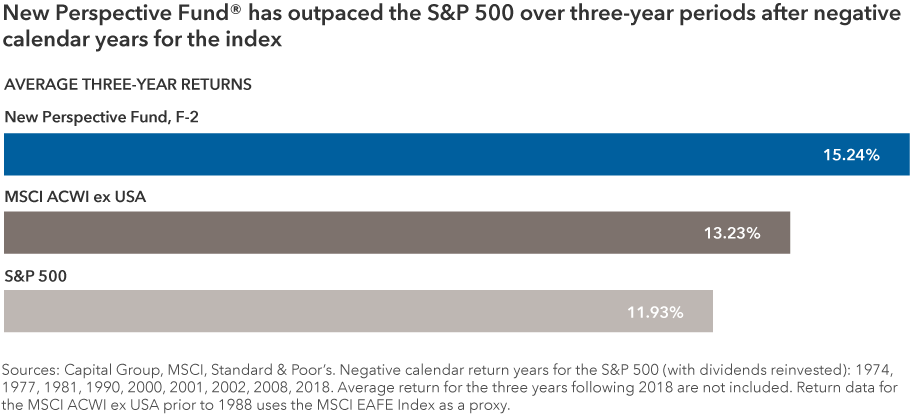
New Perspective Fund’s average return for three-year periods following a negative year for the S&P 500 has outpaced both U.S. and non-U.S. equities, as measured by the S&P 500 and MSCI ACWI ex USA.
4. Run a portfolio checkup
Capital Group’s Portfolio Consulting and Analytics team has been particularly busy during these past few months, providing thoughts to financial professionals on what to consider doing now. “We have run more than 2,000 portfolio reviews this year and seen sentiment reach extremes on both ends of the spectrum — from the utmost caution to bullish optimism to find the new market leaders,” says Mark Barile, portfolio consulting and analytics manager. “Above all else, our suggestion is to align portfolios with the objectives of the investor.”
For investors who are not exactly sure what to do now, it may be a good time to reach out to your financial professional and check in on the health of your portfolio. As the country experiences a period of widespread change, investors may require a renewed focus on goals or a reminder of the progress made toward them. Because a major shakeup in the market has the potential to knock a portfolio off balance, it may be time to rebalance the portfolio’s holdings to ensure they are in line with your investment objectives.
Investing outside the United States involves risks, such as currency fluctuations, periods of illiquidity and price volatility, as more fully described in the prospectus. These risks may be heightened in connection with investments in developing countries. Small-company stocks entail additional risks, and they can fluctuate in price more than larger company stocks.
The return of principal for bond funds and for funds with significant underlying bond holdings is not guaranteed. Fund shares are subject to the same interest rate, inflation and credit risks associated with the underlying bond holdings. Lower rated bonds are subject to greater fluctuations in value and risk of loss of income and principal than higher rated bonds. Bond ratings, which typically range from AAA/Aaa (highest) to D (lowest), are assigned by credit rating agencies such as Standard & Poor's, Moody's and/or Fitch, as an indication of an issuer's creditworthiness. If agency ratings differ, the security will be considered to have received the highest of those ratings, consistent with the fund's investment policies. Securities in the unrated category have not been rated by a rating agency; however, the investment adviser performs its own credit analysis and assigns comparable ratings that are used for compliance with fund investment policies.
The market indexes are unmanaged and, therefore, have no expenses. Investors cannot invest directly in an index.
MSCI ACWI ex USA is a free float-adjusted market capitalization-weighted index that is designed to measure equity market results in the global developed and emerging markets, excluding the United States. The index consists of more than 40 developed and emerging market country indexes.
MSCI EAFE (Europe, Australasia, Far East) Index is a free float-adjusted market capitalization-weighted index that is designed to measure developed equity market results, excluding the United States and Canada.
Standard & Poor‘s 500 Composite Index is a market capitalization-weighted index based on the results of approximately 500 widely held common stocks.
©2020 Morningstar, Inc. All rights reserved. The information contained herein: (1) is proprietary to Morningstar and/or its content providers; (2) may not be copied or distributed; and (3) is not warranted to be accurate, complete or timely. Neither Morningstar nor its content providers are responsible for any damages or losses arising from any use of this information. Past performance is no guarantee of future results.
MSCI has not approved, reviewed or produced this report, makes no express or implied warranties or representations and is not liable whatsoever for any data in the report. You may not redistribute the MSCI data or use it as a basis for other indices or investment products.
Standard & Poor’s 500 Composite Index (“Index”) is a product of S&P Dow Jones Indices LLC and/or its affiliates and has been licensed for use by Capital Group. Copyright © 2020 S&P Dow Jones Indices LLC, a division of S&P Global, and/or its affiliates. All rights reserved. Redistribution or reproduction in whole or in part is prohibited without written permission of S&P Dow Jones Indices LLC.
Our latest insights
-
-
U.S. Equities
-
Artificial Intelligence
-
Interest Rates
-
Never miss an insight
The Capital Ideas newsletter delivers weekly insights straight to your inbox.
Statements attributed to an individual represent the opinions of that individual as of the date published and do not necessarily reflect the opinions of Capital Group or its affiliates. This information is intended to highlight issues and should not be considered advice, an endorsement or a recommendation.