Artificial Intelligence
Retail
- The personal luxury goods market has grown at over 1.3 times the rate of global GDP since 1996
- Rising wealth among Asian and female consumers globally is fueling growth
- The industry has evolved into a winner-take-all business
The personal luxury segment probably doesn’t come to mind when one thinks of resilient areas of the equity market. The industry has unquestionably faced significant near-term challenges amid the pandemic. But the picture looks brighter for stronger brands. For example, when Hermès reopened its Guangzhou store in China this past April after months of lockdown, first-day sales hit a record high of $2.7 million.
There is also room for optimism more generally, as structural growth in the luxury industry has tended to offset bouts of setbacks and the associated re-rating of stocks. We explore seven themes that may help indicate how the industry will emerge from the economic downturn.
1. Luxury has outpaced the broader market
As economies around the world have become more consumption driven, personal spending has grown to be a greater portion of global GDP. The luxury goods segment, which represents a small subset of discretionary spending, has witnessed outsized growth relative to other consumer-related segments.
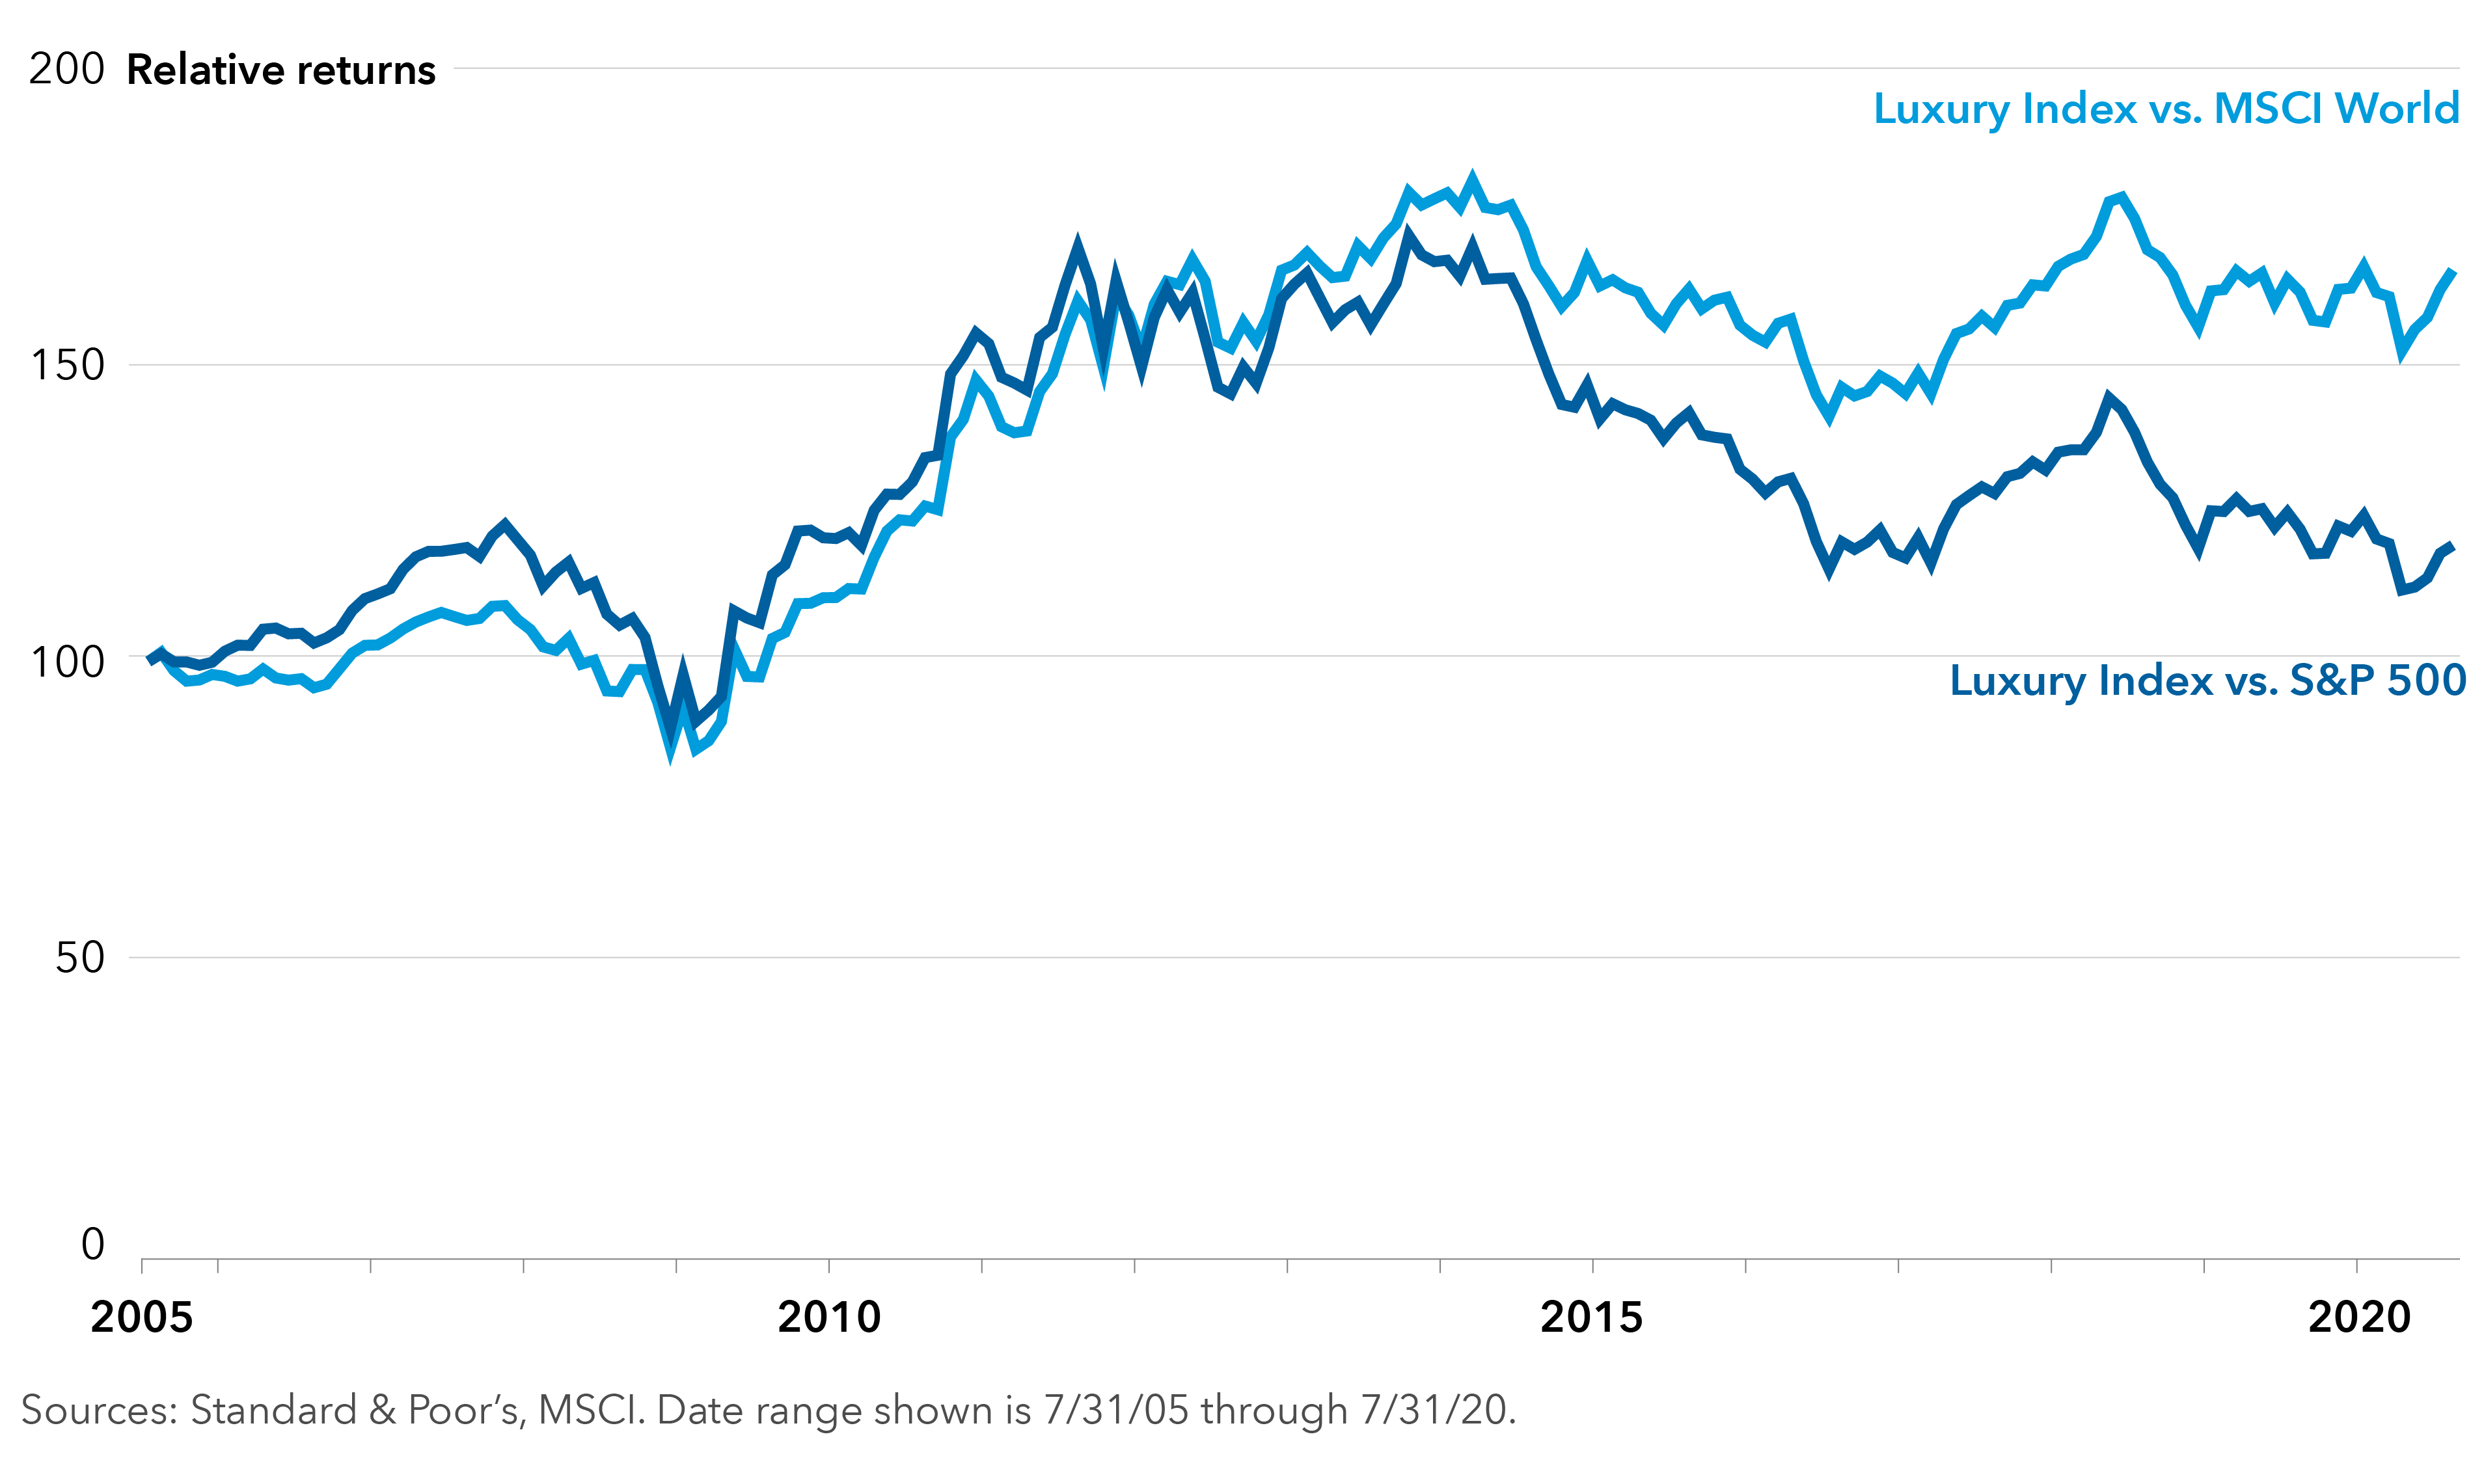
The personal luxury goods market has grown at over 1.3 times the rate of global GDP since 1996, 1 and in that span, luxury goods stocks have produced attractive long-term returns with few difficult periods. Since 2005, the S&P Global Luxury Index has delivered a greater total return than the MSCI World and S&P 500 indexes.
S&P Global Luxury Index has outpaced S&P 500 and MSCI World

2. Asian consumers underpin long-term growth
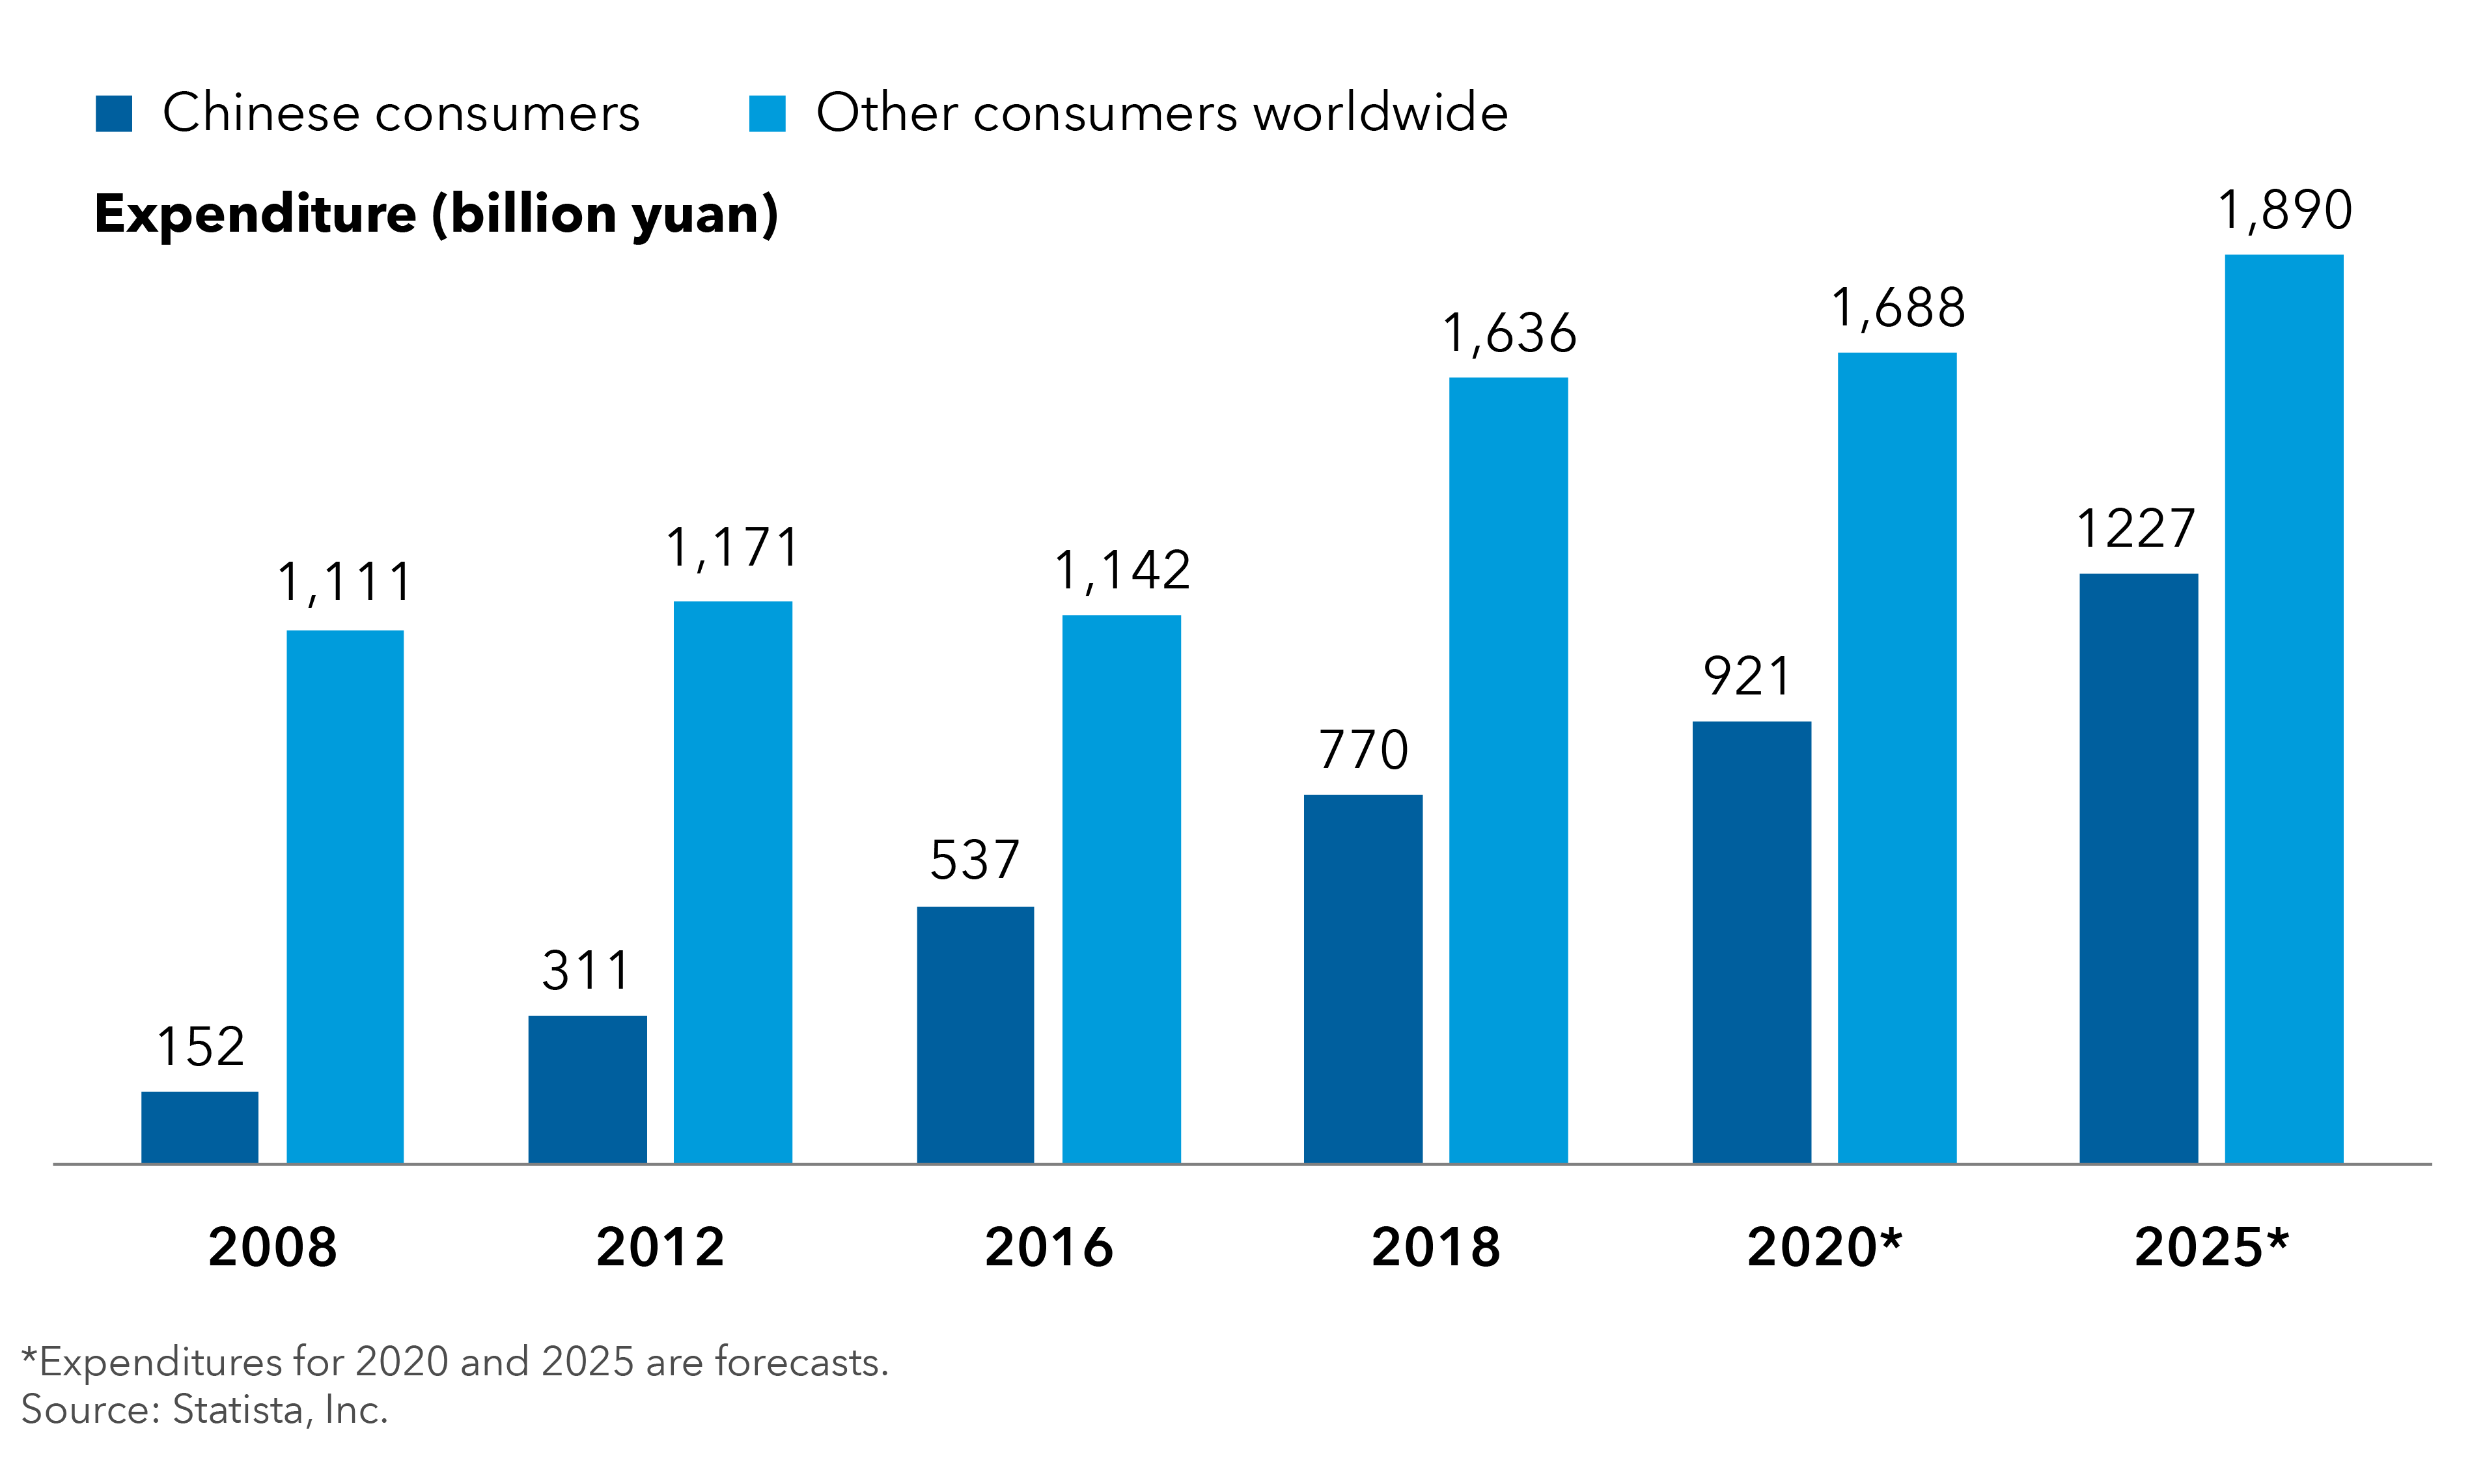
Given the discretionary nature of consumer spending, sales of luxury goods are viewed as cyclical. The evolution of a wealthy class in China and other Asian economies over the past three decades has provided the industry an underpinning of sustained and structural growth. In addition to dominating the market, Chinese customers have become highly knowledgeable about luxury products in this relatively brief time, through frequent purchases and consumption of social media.
Chinese consumers increasingly dominate spending on personal luxury goods

Over the long term, the industry’s sustained growth has tended to offset cyclicality. For instance, LVMH Moët Hennessy Louis Vuitton has compounded earnings at a 12% compound annual growth rate (CAGR) for over a decade, with earnings more than tripling over this period. Growth has been the main driver of the stock price, eclipsing shorter term changes in valuation multiples.
3. Rising wealth among women is boosting demand
Personal luxury, anchored around handbags, leather goods, apparel, accessories and jewelry, skews heavily female — and female wealth is growing. In 2019, women accounted for 45% of high net worth individuals, up from just 24% in 2008.2 This trend may position personal luxury to take share from areas of the broader luxury environment — namely, luxury cars, which is almost twice as large a market. It could also help fuel the expansion of trusted brands to other luxury categories (e.g., LVMH’s acquisition of the Belmond hospitality and leisure company).
4. Brand equity is a key driver of success
Why have some luxury companies consistently achieved 10%+ sales growth, while others haven’t recovered from the slowdown in 2015 when demand from China weakened? One key factor can be hard to find in financial statements: brand equity. Brand equity can be understood as consumers’ willingness, sustained over decades, to pay well in excess of production costs for branded goods. Management teams that maintain brand equity and are able to convert it to pricing power — manifested in higher margins and sales growth — are often the ones that achieve long-term success.
But long-term success often means growing “the hard way,” not simply opening more stores. Growing through geographical expansion can be relatively easy, but it increases penetration without necessarily increasing desirability, thus impairing pricing power. Companies that go this route often delay the moment of reckoning while diluting their brand. By contrast, companies such as LVMH that take a more disciplined approach to store expansion force their brands to increase desirability and thus pricing power.
Whether it’s Louis Vuitton bags, Ferrari sports cars, Rolex watches, Steinway pianos or Château Latour wines, consumers who own these products have a bond of trust with the brand not to debase itself by flooding the market. Cheapening these brands comes at a very high cost, as the owners of past production are often the most important customers.
Two global conglomerates serve as illustrations of industry leaders that have built brand equity over decades:
LVMH Moët Hennessy Louis Vuitton SE
LVMH is a manufacturer of luxury products that includes iconic brands such as Louis Vuitton, Hennessy, Dior, Bulgari and Sephora. The company can be viewed as a bellwether for the luxury industry, with most higher income consumers having a touchpoint to one or more of the brands. As one of the premier luxury operators in the world, LVMH has several structural advantages, including a successful track record of growing and acquiring brands, effective advertising, premium store locations, top industry talent and robust customer data. It has also benefited from strict pricing discipline. While the company has seen short-term negative effects from the COVID-19 fallout, over a longer term its brands could experience sustainable growth spurred by an expanding middle class.
Kering
Kering is a manufacturer and marketer of luxury products that includes brands such as Gucci, Bottega Veneta, Brioni, Saint Laurent and Balenciaga. The company has faced strategic challenges in the past, but it has achieved considerable success with Gucci and Saint Laurent, among others, and strengthened its business model organically and through divestitures. Additionally, Kering brands have established a track record for delivering designer-driven fashion hits. China’s middle class has demonstrated a demand for luxury status products like those from Kering, with some consumers even collecting them. With China emerging from the COVID-19 pandemic earlier than other markets, and its government implementing policies to stimulate consumer demand and relax duty-free regulations, the company may be better positioned through this difficult period.
5. Creativity contributes to the winner-take-all trend
To maintain steady revenues in a cyclical market, the best and biggest companies have supplemented high-end, extreme luxury items with mass-market goods. The reverse — making luxury out of previously non-luxury products — has also helped brands expand their margins. Examples are numerous, from Hermès horse bridles to luxury sneakers from Lanvin and Balenciaga. Brands also boost the bottom line by extending horizontally to new categories — for example, Burberry broadening to cosmetics and Gucci to housewares.
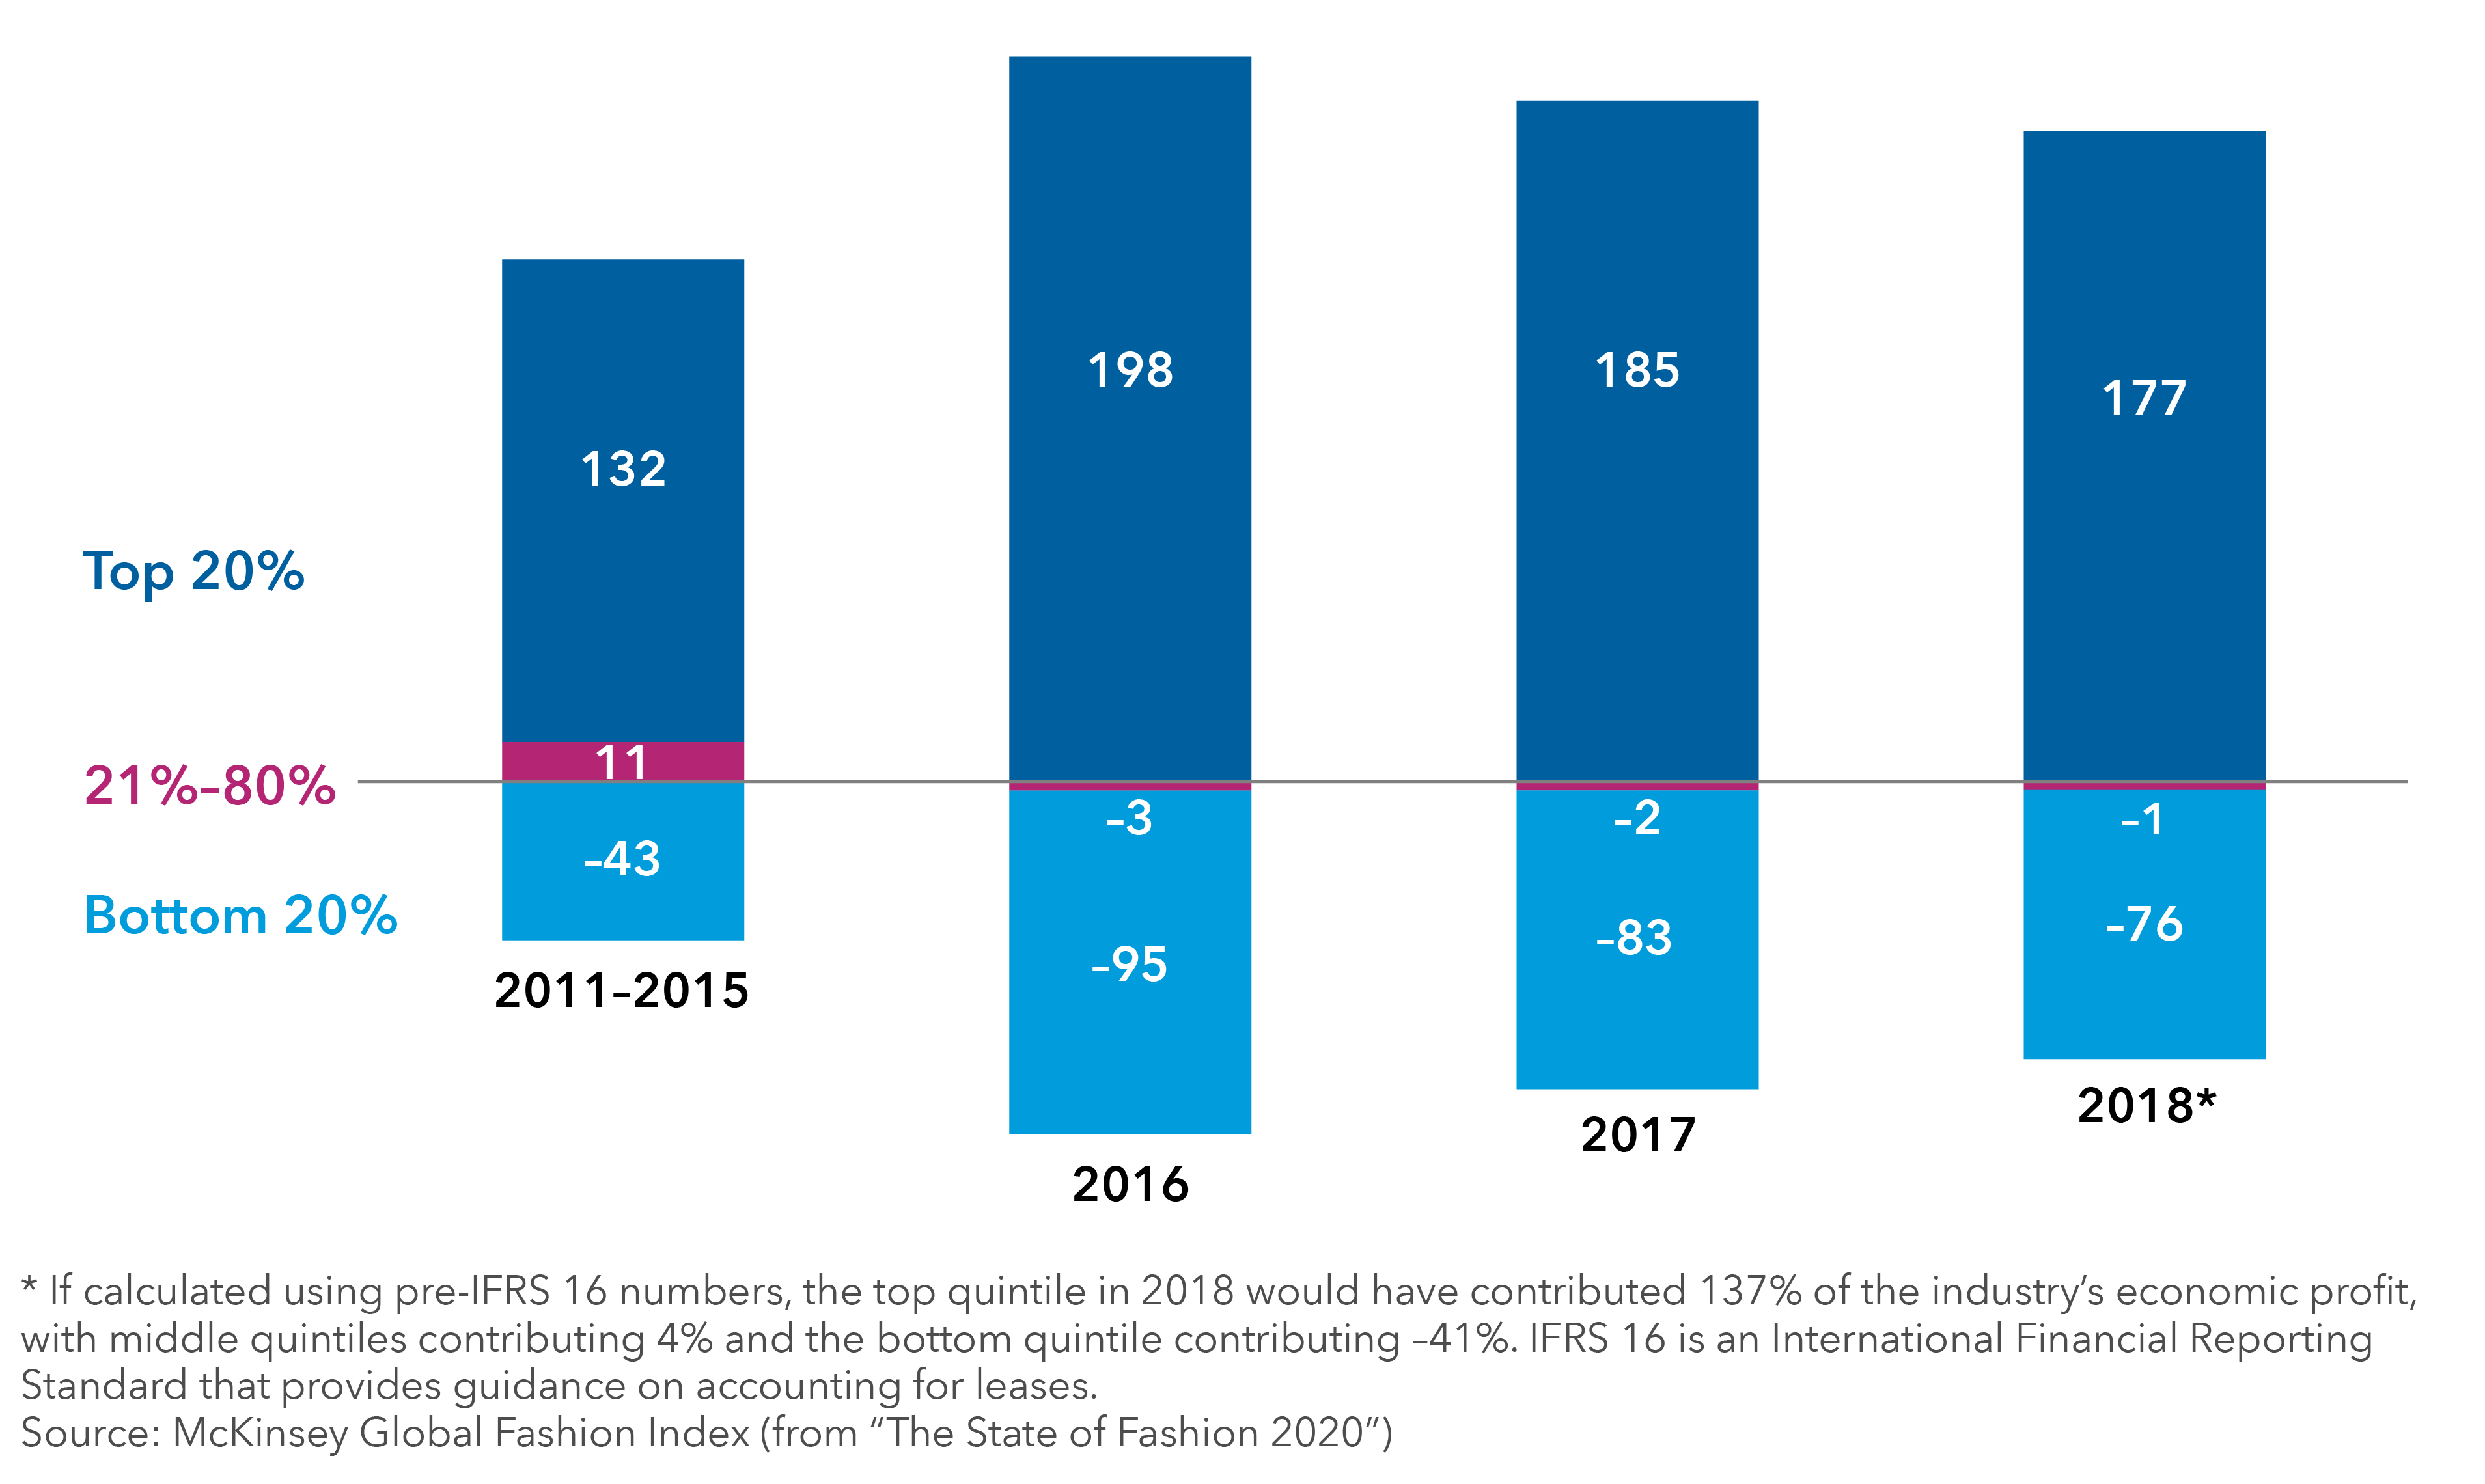
The fashion industry is a winner-take-all market
Fashion companies’ contribution to industry economic profit by ranked quintile (%)

Such creativity, differentiation and novelty can drive brand loyalty, which in turn has helped turn luxury goods into a winner-take-all industry. For example, the top 20% of fashion brands accounted for 177% of the industry’s profitability in 2018.
Notably, many categories of personal wares today remain mostly unbranded, providing room for growth. Only 6% of total jewelry sales are categorized as branded fine jewelry, for example.
6. The pivot to digital platforms has accelerated
In part because consumers are wary of purchasing expensive products without experiencing them in person, the luxury industry relies heavily on in-store shopping, with online sales representing only a small portion of business. Tourist flows account for a hefty 40% of global luxury purchases (S&P Global Market Intelligence, 2020). From this standpoint, the near-term impacts from COVID-19 amount to the perfect storm.
But the new environment is forcing even the most traditional and conservative brands to turn to e-commerce. Swiss watchmaker Patek Philippe reportedly began selling its products online for the first time in its history. Brands that had already embraced digital are expanding their strategies, finding new ways to connect with customers and cultivate sales — from live chats on their websites to virtual fashion shows and product launches on Instagram or Facebook.
The shift to digital might seem to favor smaller brands that have struggled to reach customers. However, the increased price transparency that digital brings may also cut the other way. Large, established brands are better able to protect pricing, and therefore brand value, through their control over retail. In contrast, smaller brands may be debased when their products are discounted by distressed wholesalers eager to offload inventory. Brands that never discount also hold more of their value in the resale market, and that feeds into consumers’ willingness to pay full price in the primary market.
7. Demand may be delayed or displaced
As the industry adapts to new ways of doing business, can it rebound from the drop in demand? Our analysts are finding that a lot of the demand has simply been delayed or displaced across borders. For instance, in China, consumers who once went on shopping sprees in Paris or Milan are now hitting high-end shopping districts in Beijing or Shanghai. Conversely, due to travel restrictions, luxury brand operators will have to rely largely on local customers for their European stores.
While 2020 may turn out to be a lost year for luxury earnings, it’s not a lost year for brand building and engaging with customers who are bored of social distancing, eager to return to spending and haven’t lost much, if any, of their spending power. Looking at cash flows beyond the next 12 months will thus be crucial.
1 Capital Group estimate, based on data from Altagamma and World Bank, as of September 2020.
2 Source: Capgemini Global HNW Insights Survey 2019. HNW defined as having investable assets of at least $1 million USD.
The Standard & Poor’s 500 Composite Index is a market capitalization-weighted index based on the results of approximately 500 widely held common stocks. The S&P 500 is a product of S&P Dow Jones Indices LLC and/or its affiliates and has been licensed for use by Capital Group. Copyright © 2020 S&P Dow Jones Indices LLC, a division of S&P Global, and/or its affiliates. All rights reserved. Redistribution or reproduction in whole or in part are prohibited without written permission of S&P Dow Jones Indices LLC.
S&P Global Luxury Index measures the performance of 80 of the largest companies engaged in the production, distribution or provision of luxury goods and services.
MSCI World Index is a free float-adjusted market capitalization weighted index that is designed to measure results of more than 20 developed equity markets. Results reflect dividends net of withholding taxes.
MSCI has not approved, reviewed or produced this report, makes no express or implied warranties or representations and is not liable whatsoever for any data in the report. You may not redistribute the MSCI data or use it as a basis for other indices or investment products.
Our latest insights
Never miss an insight
The Capital Ideas newsletter delivers weekly insights straight to your inbox.
Statements attributed to an individual represent the opinions of that individual as of the date published and do not necessarily reflect the opinions of Capital Group or its affiliates. This information is intended to highlight issues and should not be considered advice, an endorsement or a recommendation.
 Frank Beaudry
 Chris Dziubasik
 Jeff Norin