CASE STUDY

Getting DC participants back on track

Client profile

  • Large county pension plan in the mid Atlantic region
  • Offers a defined contribution (DC) plan
  • Sponsor encourages participation in the DC plan


The sponsor wanted to know

  • Were the DC plan’s customized models working for participants?
  • Were participants selecting an age-appropriate asset allocation?
  • Would participants be better off in target date (TD) funds that automatically adjust the asset allocation over time?

Objective

Was the plan serving employees well?

The sponsor of a public DC plan asked us to help evaluate its investment offering. The plan offered five customized asset allocation models ranging from “Ultra Aggressive” with an 85% equity allocation to “Conservative” with 20% equity. Participants chose which risk model to follow at each stage of their retirement journey.

The sponsor wondered if the plan was serving participants well, or whether workers would be better served by target date funds, which automatically adjust the asset allocation from a more aggressive to a more conservative orientation as participants approach retirement.

Research

We wanted to see how many participants had asset allocations that were potentially inappropriate for their age. If older participants allocate too much to equities (and too little to fixed income), they can be exposed to excessive market risk near retirement. Conversely, if younger participants allocate too much to fixed income (and too little to equities), they can face a greater risk of having a savings shortfall at retirement.


We compared participants’ asset allocation choices with those of professionally managed TD funds. For our benchmark, we selected the 10 largest TD mutual fund series by assets under management.*

Within this sample, the most conservative funds were the 2010 funds (10-15 years past the target retirement year), in which equity allocations ranged from 28% to 44%. The least conservative were the 2055 funds (30+ years to retirement), in which the equity allocation range was 81% to 97% at the time of the analysis (as of 6/30/2022).

We grouped each of the plan’s participants into a target retirement year based on their current age. In this way, we created 10 participant cohorts ranging from 2055 to 2010 target retirement dates. We then compared the participant equity allocations to ranges for the corresponding TD funds. We denoted these ranges as the “TD benchmarks.”

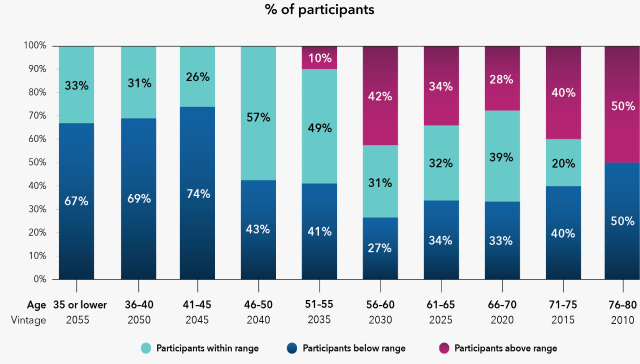
The line chart below shows the range of equity exposure of the top-10 largest TD series. The bar chart below shows the percentage of participants in each age group whose equity exposure was above, below or within that range. Participant equity allocations deviated widely, and tended to fall outside these bounds.

Participant equity allocations versus largest target date funds 

Range of equity exposure in 10 largest target date series
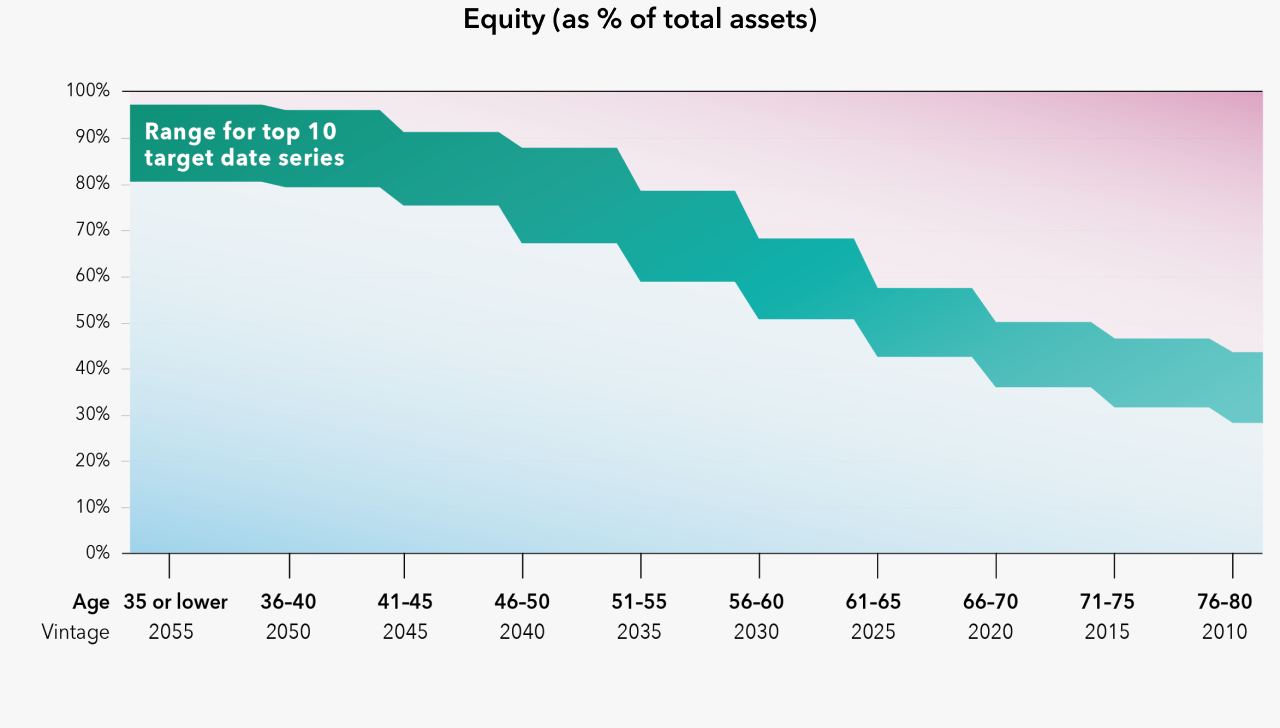
These charts compare participants' equity allocations to the range of equity allocations among the 10 largest mutual fund target date series by assets under management as of 12/31/21. The left line chart shows the range of the equity allocation (as a percentage of total assets) among the 10 largest series by age group and target date vintage by plotting the largest and smallest values and shading the area between those two lines. For the 2055 target date vintage (corresponding to investors age 35 or lower), the max equity exposure was 97.4%, while the minimum exposure was 80.7%. For the 2050 target date vintage (corresponding to investors aged 36 to 40 years old), the max equity exposure was 96.3%, while the minimum exposure was 79.6%. For the 2045 target date vintage (corresponding to investors aged 41 to 45 years old), the max equity exposure was 91.5%, while the minimum exposure was 75.6%. For the 2040 target date vintage (corresponding to investors aged 46 to 50 years old), the max equity exposure was 88.1%, while the minimum exposure was 67.4%. For the 2035 target date vintage (corresponding to investors aged 51 to 55 years old), the max equity exposure was 78.8%, while the minimum exposure was 59.2%. For the 2030 target date vintage (corresponding to investors aged 56 to 60 years old), the max equity exposure was 68.4%, while the minimum exposure was 51.0%. For the 2025 target date vintage (corresponding to investors aged 61 to 65 years old), the max equity exposure was 57.6%, while the minimum exposure was 42.8%. For the 2020 target date vintage (corresponding to investors aged 66 to 70 years old), the max equity exposure was 50.3%, while the minimum exposure was 36.2%. For the 2015 target date vintage (corresponding to investors aged 71 to 75 years old), the max equity exposure was 46.8%, while the minimum exposure was 31.8%. For the 2010 target date vintage (corresponding to investors aged 76 to 80 years old), the max equity exposure was 43.8%, while the minimum exposure was 28.4%.

Participant equity allocations 

The right chart shows the percentage of this plan's participants whose self-selected equity allocation fell above, within or below the range of equity exposures of the 10 largest target date mutual fund series by assets under management. For the 2055 target date vintage (corresponding to investors age 35 or lower), 67% of participants fell below the range, 33% were within the range and 0% were above the range. For the 2050 target date vintage (corresponding to investors aged 36 to 40 years old), 69% of participants fell below the range, 31% were within the range and 0% were above the range. For the 2045 target date vintage (corresponding to investors aged 41 to 45 years old), 74% of participants fell below the range, 33% were within the range and 0% were above the range. For the 2040 target date vintage (corresponding to investors aged 46 to 50 years old), 43% of participants fell below the range, 57% were within the range and 0% were above the range. For the 2035 target date vintage (corresponding to investors aged 51 to 55 years old), 41% of participants fell below the range, 49% were within the range and 10% were above the range. For the 2030 target date vintage (corresponding to investors aged 56 to 60 years old), 27% of participants fell below the range, 31% were within the range and 42% were above the range. For the 2025 target date vintage (corresponding to investors aged 61 to 65 years old), 34% of participants fell below the range, 32% were within the range and 34% were above the range. For the 2020 target date vintage (corresponding to investors aged 66 to 70 years old), 33% of participants fell below the range, 39% were within the range and 28% were above the range. For the 2015 target date vintage (corresponding to investors aged 71 to 75 years old), 40% of participants fell below the range, 20% were within the range and 40% were above the range. For the 2010 target date vintage (corresponding to investors aged 76 to 80 years old), 50% of participants fell below the range, 0% were within the range and 50% were above the range. Source: Morningstar and Capital Group (based on plan demographic data). The sample size for participants older than 65 was small (25 in total).

Sources: Morningstar and Capital Group (based on plan demographic data). The sample size for participants older than 65 was small (25 in total).

Findings

  • Participant asset allocations diverged significantly from their TD benchmarks. Up to two-thirds of participants may have had inappropriate equity exposure (meaning their equity allocations were above or below the corresponding TD benchmark).
  • Younger participants tended to hold less equity than the TD benchmarks, likely putting them at greater risk for a retirement savings shortfall. For example, three-quarters of participants with a 2045 target retirement date (41-45 years old) had equity allocations below their TD benchmark’s lower bound of 76%. Some participants in this group had merely 20% in equities.
  • Some older participants held more equity than the TD benchmarks, leaving them more exposed to damage from stock market downturns in retirement. For example, one-third of the 2025 group (61-65 years old) had equity allocations above their TD benchmark’s upper bound of 58%.
  • The plan’s custom risk models incurred higher costs than TD funds yet underperformed. The model expense ratios ranged from 29 basis points (bps) to 78 bps, while most TD funds in the sample had expense ratios under 50 bps (and some as low as 8 bps). Most of these TD funds had outperformed the custom models on a risk-adjusted basis, using a 10-year lookback period.

Key takeaways

Risk exposures for most self-directed participants fell outside industry standards.

Younger participants tended to invest too conservatively, while many older participants assumed too much equity risk.

Participants often struggle to maintain an appropriate asset allocation.

TD funds have proliferated because they empower individuals to delegate asset allocation decisions to professional managers.

We suggested a move to target date funds.

We suggested that the plan sponsor shift participants out of the customized risk models and into age-appropriate TD funds. We also suggested that new employees be automatically enrolled into those funds.

Discover our institutional capabilities

We work with defined contribution plans, defined benefit plans and nonprofits to seek better outcomes.

Let us help your plan

We can partner with you to analyze your plan’s challenges and explore solutions.

* The top 10 series at the time of the analysis were the same as those as of 12/31/23.

Investments are not FDIC-insured, nor are they deposits of or guaranteed by a bank or any other entity, so they may lose value.
Investors should carefully consider investment objectives, risks, charges and expenses. This and other important information is contained in the fund prospectuses and summary prospectuses, which can be obtained from a financial professional and should be read carefully before investing.
All Capital Group trademarks mentioned are owned by The Capital Group Companies, Inc., an affiliated company or fund. All other company and product names mentioned are the property of their respective companies.
Use of this website is intended for U.S. residents only.
Capital Client Group, Inc.
This content, developed by Capital Group, home of American Funds, should not be used as a primary basis for investment decisions and is not intended to serve as impartial investment or fiduciary advice.