CASE STUDY
Retirement readiness analysis for a public plan
Client profile
- Large county public plan
- Located in San Francisco Bay area
- 10,000+ active employees
- 80% general workers
- 20% safety workers
- Open defined benefit (DB) plan
- Supplemental defined contribution (DC) plan
The sponsor wanted to know
- How robust was the DB income floor for retirees?
- Which employees could meet a more ambitious income replacement target?
- Which participants would rely heaviest on the DC plan to meet the target?
- What can the plan sponsor do to help improve participant outcomes?
Objective

Analyze workers’ retirement readiness
We were asked to assess the retirement readiness of participants in a public pension plan and offer ideas for enhancements. The plan offers both a DB component and a voluntary DC component. This plan faces a unique challenge: It sits in one of the most expensive places to live in the U.S.
To be able to retire in this high-cost area, the plan set a target to replace 85% of participants’ pre-retirement income. The plan sponsor wanted to know which employees were most likely to fall short of the target, and how the sponsor might help them close the gap.
Research
We estimated workers’ retirement income
Findings
Some workers might fall short of more ambitious income targets
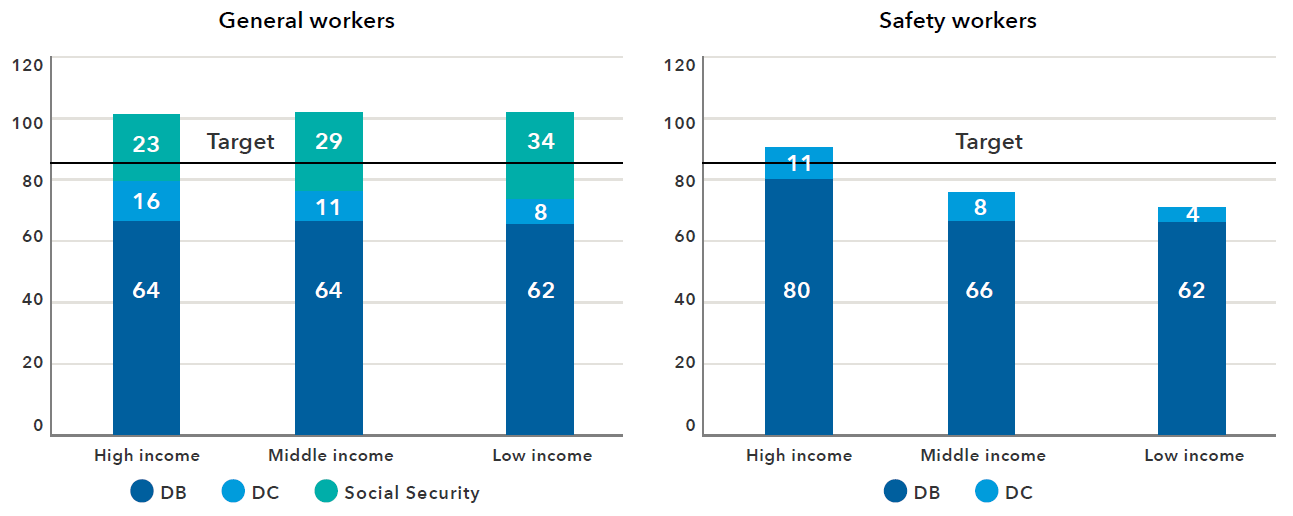
The plan sponsor was pleased that the DB plan provided all worker types with an income replacement ratio above 60%, putting it in good company with comparable plans. When we stress-tested the 85% goal, we found that safety workers (especially low- to middle-income workers) were more likely to fall short.
In contrast, all types of general workers were likely to reach it — but only because they get Social Security. Their DB and DC assets alone were insufficient to reach the 85% target. Social Security-ineligiblity prevented the representative safety workers in low- and middle-income cohorts from meeting the 85% goal. Only high-income safety workers were projected to achieve 85% using just DB and DC sources.
Most safety workers fell short of the 85% target
Projected income replacement rates across cohorts (%)

Source: Capital Group. Based on a simulated glidepath using existing equity percent allocations by current participant age in plan.1
Key takeaways
Overall, participants were in good shape
The DB created a robust income floor. All worker types we modeled would receive at least a 62% income replacement using the DB plan alone. No type of worker was at risk of running out of money.2 And it’s important to note that many safety workers take jobs after they retire to supplement their income.
Safety workers were less likely to reach 85%
Looking at all benefit sources together, general workers (DB, DC and Social Security) and high-income safety workers (DB and DC) were likely to exceed the 85% target, but other safety workers were unlikely to meet this ambitious target.
Safety workers were more reliant on DB
Safety workers tend to get higher income replacement rates from the DB plan than general workers because they contribute a larger percentage of income to the DB plan and receive higher benefit multipliers. But they stand to get less from the DC plan because they retire earlier. And, as with many state and local public workers nationally, they won’t get Social Security because they are ineligible for that federal program.
Promoting the DC plan is key
To get more employees to 85%, the plan sponsor needs all employees (but especially safety workers) to understand that the DC plan is more than a nice-to-have addition to the DB plan. It is a core part of their total retirement strategy.
We provided three ideas to improve the DC plan
- Boost savings rates/plan balances: The sponsor could start workers’ contributions as early as possible in their careers; provide auto-enrollment (if permitted by state law); offer an employer match; and provide intensive “retirement-ready” education programs.
- Evaluate different DC asset allocations: For example, general workers typically have longer investment horizons because they retire later and have the additional cushion of Social Security. They can be potentially more risk-seeking in their DC plans (for example, by holding larger equity allocations for longer).
- Educate participants about DC withdrawal timing: The plan sponsor should consider educating and guiding safety and general workers in a way that is appropriate to each group. For example, both safety and general workers may have some room to delay withdrawals from DC balances by virtue of the generous DB plan.
Discover our institutional capabilities
We work with defined contribution plans, defined benefit plans and nonprofits to seek better outcomes.
Let us help your plan
We can partner with you to analyze your plan’s challenges and explore solutions.
Contact us
institutional@capgroup.com
1 Safety workers were assumed to have a 4.5% annual DC withdrawal rate at retirement. Because general workers are more likely to work to age 65 and to thus have a shorter retirement than safety workers, general workers were assumed to have a 6% withdrawal rate. Withdrawals were grown by 2.75% each year as a proxy for inflation.
2 This model, which is based on demographic and returns assumptions, is intended to provide a basic estimate of the overall adequacy of this plan's benefits. It is not intended to be predictive or to provide any guarantee of future results or outcomes. Actual results and outcomes will differ from what are shown here and will vary by individual.
