Market Volatility
In observance of the Christmas Day federal holiday, the New York Stock Exchange and Capital Group’s U.S. offices will close early on Tuesday, December 24 and will be closed on Wednesday, December 25. On December 24, the New York Stock Exchange (NYSE) will close at 1 p.m. (ET) and our service centers will close at 2 p.m. (ET)

MARKET VOLATILITY
Guide to current markets
Insights, tools and resources from Capital Group to help you during unsteady markets
Featured

MARKETS & ECONOMY
Rob Lovelace on all-weather investing
Rob Lovelace, vice chair and president of Capital Group, offers his view of the 2022 bear market and what it means for investors.
WEBINAR SERIES
Deep dive on markets
Join our investment team as we examine the forces roiling markets
PODCAST SERIES
Capital Ideas podcast
Connect to the minds and insights shaping the world of investments

INSIGHTS
World Markets Review for 3Q 2024
Rate cuts fuel market rally
Market insights and analysis
Timely and actionable insights to help you make sense of the markets and guide your investment decisions
-
Guide to recessions: 9 things you need to knowOctober 11, 2024
-
Webinar
-
Market Volatility
Guide to stock market recoveriesSeptember 30, 2024
Investment results

Get the latest results for our funds, CITs and separate accounts.
Get the latest results for our strategies
Experience matters
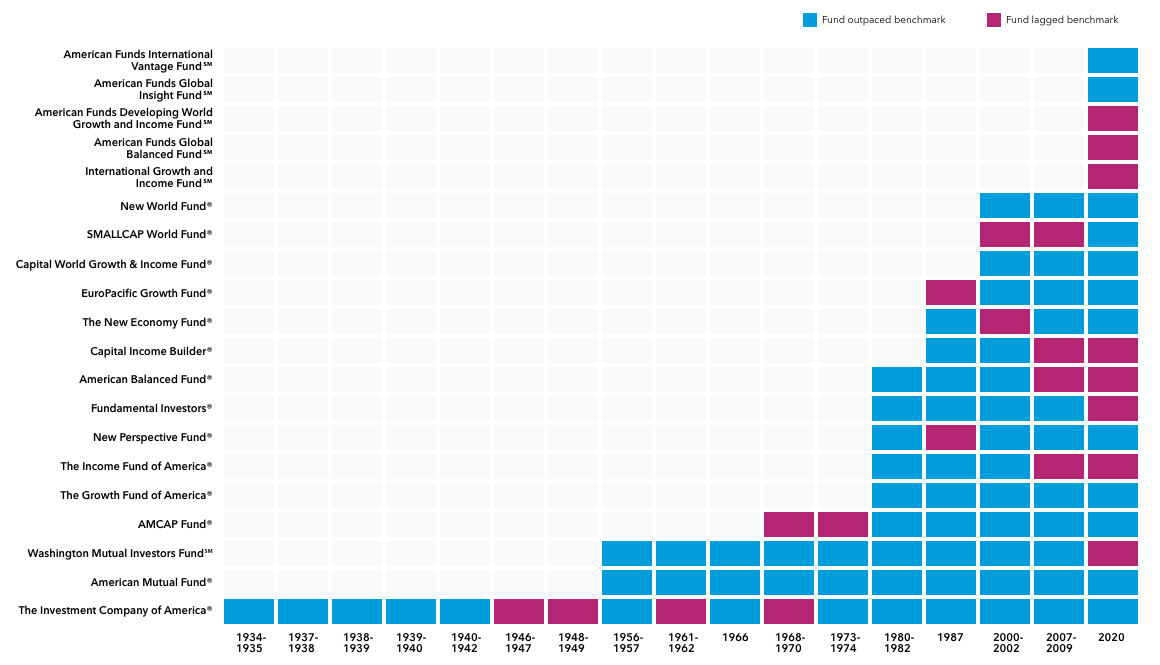
Throughout our history, we've weathered past storms. In fact, our equity-focused funds have outpaced their benchmark indexes during the biggest downturns of the last nine decades.
Across 17 bear markets, the equity-focused American Funds outpaced their benchmarks 77% of the time.

Experience matters
Throughout our history, we've weathered past storms. In fact, our equity-focused funds have outpaced their benchmark indexes during the biggest downturns of the last nine decades.
Across 17 bear markets, the equity-focused American Funds outpaced their benchmarks 77% of the time.
Sources: Capital Group, Morningstar. Class F-2 and R-6 shares with all distributions reinvested. View fund expense ratios and returns.
Dates shown for bear markets are based on price declines of 20% or more (without dividends reinvested) in the unmanaged S&P 500 with at least 50% recovery between declines. Funds shown are the equity-focused American Funds in existence at the time of each decline. Fund and benchmark returns are based on total returns.
Class F-2 shares were first offered on August 1, 2008. Class F-2 share results prior to the date of first sale are hypothetical based on Class A share results without a sales charge, adjusted for estimated annual expenses. The results shown are before taxes on fund distributions and sale of fund shares. Past results are not predictive of results in future periods. Results for other share classes may differ.
Class R-6 shares were first offered on May 1, 2009. Class R-6 share results prior to the date of first sale are hypothetical based on Class A share results without a sales charge, adjusted for typical estimated expenses. Please see the fund’s prospectus for more information on specific expenses.
Benchmark indexes for the funds: S&P 500 (ICA, AMF, WMIF, AMCAP, GFA, FI); MSCI World (NPF, WGI, GIF); 60% S&P 500 / 40% Bloomberg Barclays U.S. Aggregate (AMBAL); 65% S&P 500 / 35% Bloomberg U.S. Aggregate (IFA); 70% MSCI ACWI / 30% Bloomberg Barclays U.S. Aggregate (CIB); S&P 500 prior to the 2020 bear market, MSCI ACWI thereafter (NEF); MSCI EAFE prior to the 2007-09 bear market, MSCI ACWI ex USA thereafter (EUPAC); MSCI ACWI Small Cap (SMALLCAP); MSCI ACWI (NWF); MSCI ACWI ex USA (IGI), 60% MSCI ACWI / 40% Bloomberg Barclays Global Aggregate (GBAL); MSCI Emerging Markets (DWGI); MSCI EAFE (IVE).
Support
Resources to help guide your conversations
Statements attributed to an individual represent the opinions of that individual as of the date published and do not necessarily reflect the opinions of Capital Group or its affiliates. This information is intended to highlight issues and should not be considered advice, an endorsement or a recommendation.