LIABILITY-DRIVEN INVESTING / MAP OF LIABILITY-DRIVEN OPPORTUNITY SET
Your map of the LDI opportunity set
- Corporate defined benefit pension plan sponsors pursuing LDI generally turn to the U.S. long bond market to hedge long-term liabilities.
- A detailed understanding of this $3.5 trillion market is critical for crafting an effective investment strategy.
- Our new map of the market can help sponsors navigate the opportunities and challenges of LDI implementation.
Explore long bonds
See the U.S. long bond market’s components and credit quality as we build the map from the ground up
Transcript:
Visualizing the LDI Opportunity Set
Narrator:
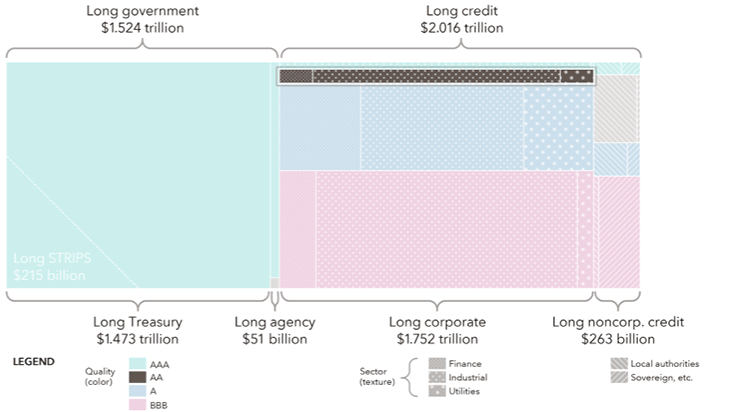
If you're a defined benefit pension plan sponsor trying to craft an effective LDI strategy, you need a detailed understanding of the U.S. long bond market. Capital Group's LDI Solutions Team has built a map of this $3.5-trillion-dollar market to help sponsors understand the landscape. The map represents the physical bonds that U.S. corporate defined benefit plans most frequently use to implement their LDI strategies.
We'll start by breaking the investment-grade bond market into its two major components, long government bonds and long credit. Sponsors also use U.S. Treasury STRIPS to hedge long-term liabilities. Here, we overlay STRIPS with maturities of at least 10 years on the government section of the investment-grade market to give you a sense of their relative size.
Digging deeper, the long government segment of the market is composed almost entirely of long Treasury bonds, but it also contains a sliver of agency bonds, which includes bonds from federal government agencies and government-sponsored enterprises such as Fannie Mae and Freddie Mac.
On the credit side, we find mostly corporate bonds along with non-corporate credits such as sovereigns and local authorities. These are the major building blocks of the long bond market. Now, we're ready to fill in the details.
First, let's look at credit quality. Nearly all government bonds are rated AAA, but more than half of investment-grade credit bonds are rated BBB, reflecting weakening credit quality over time. The rest are rated A, AA, and AAA. Notice the scarcity of AA-rated corporate credit, which plays an important role in implementing LDI strategies.
Now, we'll finish the map by breaking it down by sector. We divide investment-grade corporate bonds into finance, industrial, and utilities and the non-corporate section into local authorities and sovereigns.
That's our map of the long bond market, a handy tool to enhance pension investment decisions around LDI benchmarking and other issues that are critical for achieving positive outcomes for plan sponsors and participants. For more detail on the long bond market, please read our white paper, Charting the LDI Opportunity Set, available at capitalgroup.com.
Source: Barclays POINT data ©2019 Barclays Capital Inc. Used with permission. POINT is a registered trademark of Barclays Capital Inc. Data in market value terms as of 3/31/19. Split by index, then credit quality, then sector.
Please see the bottom of the page for further disclosure.
Fast facts from our map of the U.S. long bond universe
-
-
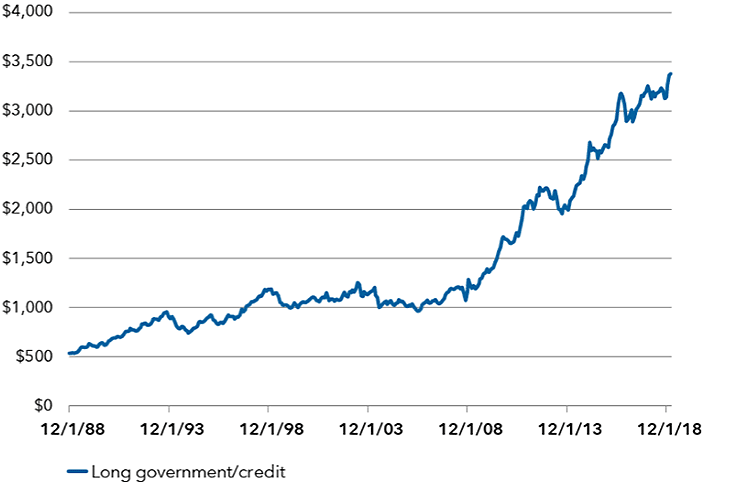
Rapid growth
Long government/credit supply (USD billions)

Source: Barclays POINT. Data in market value terms from 12/31/88 to 3/31/19.
Rapid growth: At $3.5 trillion, the U.S. long bond market has more than tripled in size since the global financial crisis.
-
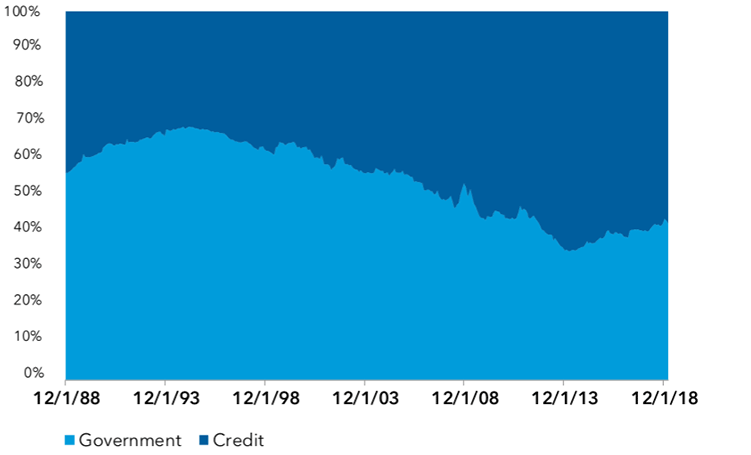
More credit

Source: Barclays POINT. Data in market value terms from 12/31/88 to 3/31/19.
More credit: As the market has grown, its composition has changed. U.S. government bonds made up more than two-thirds of the market in the mid-1990s; now credit accounts for more than half of the investable universe.
-
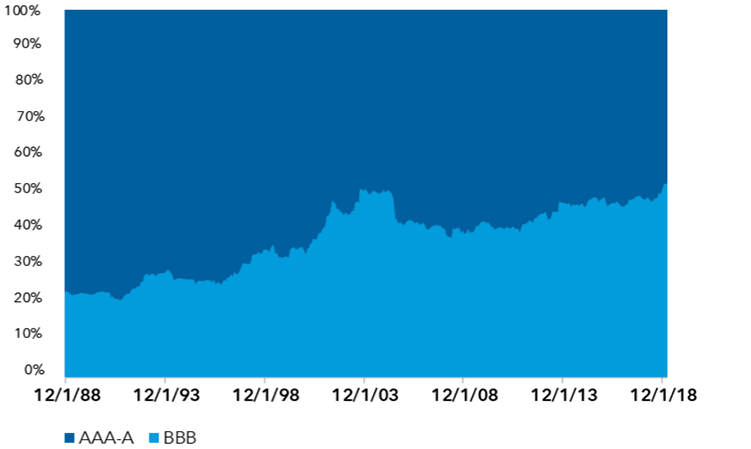
Weaker quality

Source: Barclays POINT. Data in market value terms from 12/31/88 to 3/31/19. Bond ratings, which typically range from AAA/Aaa (highest) to D (lowest), are assigned by credit rating agencies such as Standard & Poor's, Moody's and/or Fitch, as an indication of an issuer's creditworthiness.
Weaker quality: As the credit component of the market has expanded, quality has weakened. Bonds rated triple-B account for more than half of long credit bonds, more than double the level in the late 1980s.
-
Pockets of scarcity

Source: Barclays POINT. Data in market value terms as of 3/31/19. Split index, then credit quality, then sector.
Note: "Long STRIPS" refers to U.S. Treasury STRIPS with maturities of at least 10 years, which are not part of the Bloomberg U.S. Long Government/Credit index, but which are included to indicate relative sizing.
Pockets of scarcity: Despite the market’s sharp growth, some portions are comparatively small. For instance, although AA-rated corporate bonds play a critical role in liability measurement, their limited depth and breadth will often require sponsors to add other types of bonds to their hedging toolkit.
-
“We believe that a map of the long bond market can facilitate a productive benchmarking dialogue and ultimately enhance decision-making.”

Colyar Pridgen
Senior LDI Strategist, Capital Group
Contact us today to discuss how to put this idea into action.
Bond ratings, which typically range from AAA/Aaa (highest) to D (lowest), are assigned by credit rating agencies such as Standard & Poor's, Moody's and/or Fitch, as an indication of an issuer's creditworthiness.
“Long STRIPS” refers to U.S. Treasury STRIPS with maturities of at least 10 years, which are not part of the Bloomberg U.S. Long Government/Credit index. While depicted as a subset of long Treasury in order to offer a broad sense of the relative size of an important component of the universe of physical hedging instruments (and to avoid potentially double-counting stripped Treasuries), note that STRIPS are not in fact a component or subset of Treasuries. Note also that because Long STRIPS contain no cash flows before 10 years (while long Treasury, on the other hand, does implicitly incorporate shorter-dated cash flows in the form of coupon payments), there is some measure of inconsistency worth noting (e.g., arguably, technically nine-year coupon STRIPS could be included here, to the extent that they are created from coupons of long Treasuries).
“Sovereign, etc.” refers to the aggregated-for-convenience sectors of sovereign (the largest sector included herein), foreign agencies (which have similar quality distribution though skewed somewhat higher), and supranational (a relatively small sector which in the long end is entirely AAA-rated bonds). The other noncorporate credit sector, shown distinctly, is described as “local authorities,” which is technically the Class 2 description for the foreign local governments sector.
Before 6/30/2000, many credits that today would be categorized as long corporate were instead a component of the long noncorporate credit universe, with the legacy sector name foreign corporations. These securities have been included in the “Sovereign, etc.” category for periods prior to 6/30/2000.
Before 6/30/2000, many credits that today would be categorized in the foreign local governments sector (which we call “local authorities”) were instead identified by the legacy sector name Canadian. These securities have been included under “local authorities” in our historic figures.


