Market Volatility
Fed
Are we there yet? No one can say for sure. The Federal Reserve once again hit pause on interest rates at its September meeting but left the door open for at least one additional hike in 2023.
The most important question for investors now, however, is not how high will rates go but rather, how long will high interest rates last?
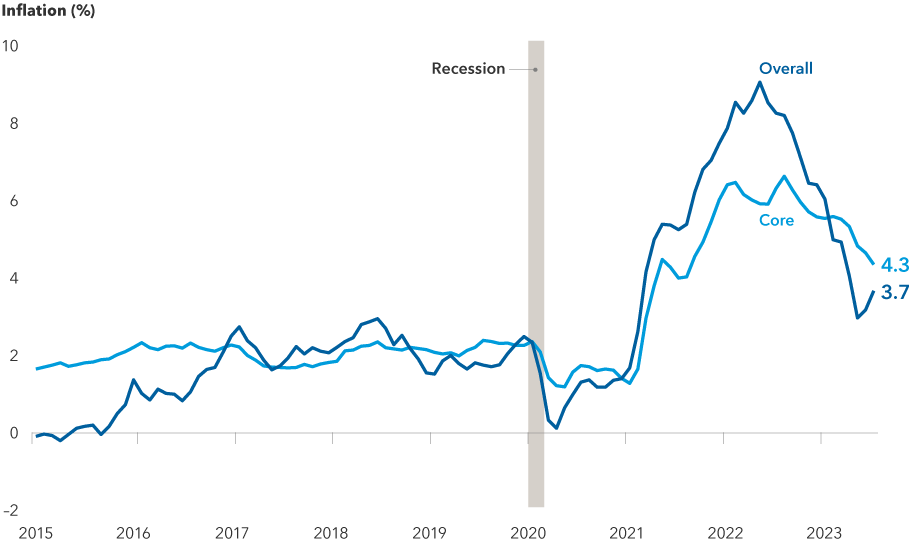
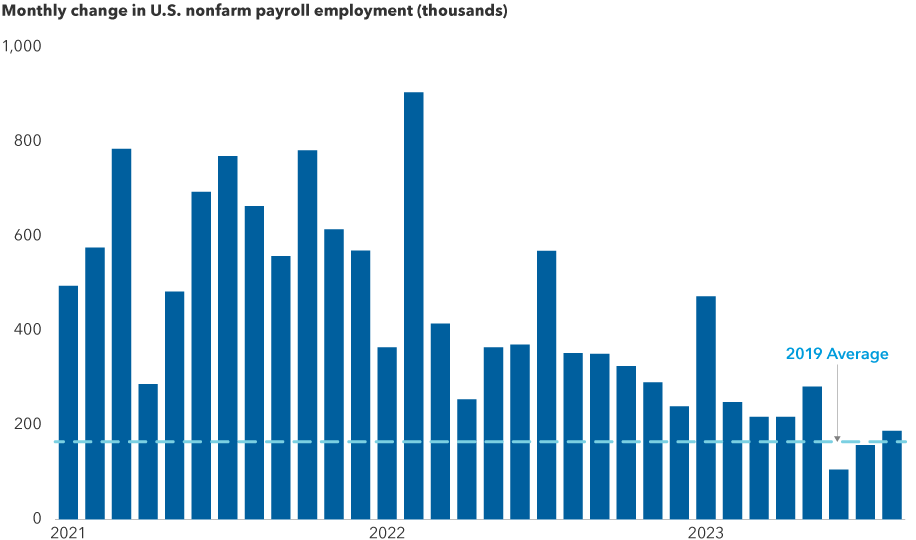
The answer will depend on the data. The most important indicator, of course, will be inflation. The core Consumer Price Index (CPI), which strips out volatile components like food and energy, fell to 4.3% for the year ending August 31, from 4.7% in July. Labor data has also begun to cool, with job openings, wage growth and hiring numbers all slowing down. The federal funds rate target range currently stands at 5.25% to 5.50%, its highest level in 22 years.
The Fed’s board of governors moved their rate projections higher for next year, penciling in just 50 basis points in potential cuts, compared to a 100-basis point reduction in the June forecast. But the timing of those cuts is yet to be determined.
In remarks following the Fed’s announcement, Chair Jerome Powell struck a hawkish tone, indicating the central bank is concerned that continued economic growth in the U.S. could reignite inflation. He avoided explicitly stating what could move the central bank to cut rates.
"Stronger economic activity means we have to do more with rates,” Powell said. “It may, of course, be that the neutral rate has risen.” The neutral rate is a theoretical federal funds rate at which monetary policy is considered neither accommodative nor restrictive.
Inflation has fallen dramatically since last summer, supporting a Fed pause

Sources: Bureau of Labor Statistics, Refinitiv Datastream. Overall and core inflation represent the change from the previous year in the Consumer Price Index and the Consumer Price Index excluding food and energy, respectively. As of August 31, 2023.
Many investors thought the economy would have weakened substantially by now, and it simply hasn’t. However, monetary policy works with a lag. There are signs consumers have depleted their pandemic-era savings and are more reliant on credit cards. Historically, that pattern points to lower spending, and our analysts have also noted that consumers are on the hunt for more affordable alternatives.
A cooling job market could remove pressure for additional rate hikes

Sources: Bureau of Labor Statistics, Refinitiv Datastream, U.S. Department of Labor. Figures are seasonally adjusted. As of August 31, 2023.
It is possible the Fed will bring rates back down slowly as we continue to chip away at inflation, says David Hoag, a portfolio manager for The Bond Fund of America®, but he does not expect we will reach the 2% inflation target or a neutral policy level in the near future.
However, if things sour quickly, the Fed has given itself a lot of dry powder to stimulate the economy. “If the economy worsens significantly, we can quickly get back to neutral interest rates, which I believe to be around 3.0% to 3.5%,” Hoag says. “That’s a big move, if needed, and the Fed could execute it with no embarrassment and no excuses.”
In some ways, Powell needs to continue striking a somewhat hawkish tone to avoid undoing the work the Fed has already done tightening financial conditions, according to Hoag. If Powell were to pivot to a dovish tone, investors would likely push the front end of the yield curve down and send equity and corporate bond markets soaring. That could result in a rapid loosening of financial conditions, which would risk reigniting inflation.

Webinar: Historic opportunities in sight
What’s the outlook for inflation in the near term?
Overall, inflation has steadily declined over the last six months — a trend that was confirmed by August’s CPI report. The headline number for August was higher than expected, and that caught a lot of attention. But the underlying data still suggests that inflation is moderating. Shelter inflation, which includes rent and owners’ equivalent rent, continued to drop. These are the largest components of the CPI and will likely continue moderating for the next six to nine months, as rents are flattening out or declining in many cities.
There have already been declines in certain types of rental housing costs. What’s more, productivity is rebounding, unit labor costs are slowing, and China’s economic troubles are helping to keep commodity price increases in check. Goods inflation is also trending lower as consumers have shifted from buying things to spending on services like travel and medical care. As such, core services prices have remained firm and could be expected to come down or plateau.
“The net impact of these factors could be that we see core inflation at 2% by the end of next year. That would be a full year ahead of schedule and justify modest rate cuts,” says economist Jared Franz.
What is the longer term trend on inflation?
In the near term, inflation looks as though it should continue falling from its current elevated levels. Longer term, the multi-decade trend of disinflation appears to have come to an end as several long-term structural factors have shifted.
“Disinflationary pressures created by global excess savings over the last 40 years are ending due to demographic changes like declining life expectancies. Higher corporate tax rates and populism-driven labor legislation, like increased minimum wages, are stopping the decline of labor’s share of the economy. Globalization has reached a political and physical plateau. This could put upward pressure on yields,” says Capital World Bond Fund® portfolio manager Tom Reithinger.
The Fed could become comfortable with inflation settling above its 2% target, but it would depend on what else is going on in the economy. “If growth were to falter and unemployment started to rise, we could see the Fed allowing inflation to run higher than its official target and still ease monetary policy to support the economy,” Reithinger adds.
Higher inflation is not just a U.S. phenomenon. Last week the European Central Bank (ECB) lifted benchmark rates by 25 basis points, taking the deposit rate to 4%. Nevertheless, the central bank took a more dovish posture in its communication, signaling that it might have raised rates high enough to return inflation closer to its target.
“Although it did not rule out further rate increases, the ECB has less flexibility than the other major central banks,” Reithinger says. “With Germany at risk of a recession, the central bank could face a scenario where inflation stays high and growth stalls.”
What’s in store for interest rates?
Over the next year, U.S. Treasury yields could start coming down as inflation cools, especially at the short end of the yield curve. Short-term rates could well move lower before the Fed actually cuts.
If medium- to long-term rates continue to hover near current levels as short rates decline, with the yield on benchmark 10-year Treasury and 30-year Treasury fluctuating between 3% and 4%, the inverted yield curve should give way to a positively sloped curve.
Overall, this environment can be positive for fixed income. “From a historical perspective, fixed income has done well when the hiking cycle ends and the Fed pivots to a pause. Bond yields have typically held steady in these transitions, and investors have enjoyed the benefits of higher interest rates,” says Tim Ng, a portfolio manager for American Funds Inflation Linked Bond Fund®.
“And if the economy were to tip into a recession and the Fed is forced to cut, that's when fixed income should really benefit portfolios through capital appreciation from falling interest rates.”
In the stock market, Capital Group economist Jared Franz says additional policy guidance could help boost investor sentiment.
“Equity gains so far this year have largely come from multiple expansion,” he says. “Markets have been resilient despite higher rates: Labor markets have remained strong and consumer demand has been resilient, with corporate America for the most part delivering on earnings. However, market gains have been led by a narrow group of stocks. Market breadth could expand as investors gain greater clarity on Fed policy over the next year.”
The Consumer Price Index (CPI) is a measure of the average change over time in the prices paid by urban consumers for a market basket of consumer goods and services.
Related resources
Webinar: Historic opportunities in sight
RELATED INSIGHTS
-
5 charts that put market volatility in perspective
-
Market Volatility
Trump tariffs roil markets. What’s next? -
Market Volatility
How to handle market declines
Never miss an insight
The Capital Ideas newsletter delivers weekly insights straight to your inbox.
 Timothy Ng
 Tom Reithinger
 David Hoag