info
On Christmas Day, the New York Stock Exchange and Capital Group’s U.S. offices will be closed.

In observance of the Christmas Day federal holiday, the New York Stock Exchange and Capital Group’s U.S. offices will close early on Tuesday, December 24 and will be closed on Wednesday, December 25. On December 24, the New York Stock Exchange (NYSE) will close at 1 p.m. (ET) and our service centers will close at 2 p.m. (ET)

Sample asset allocation details

Take a closer look at our sample asset allocations, including best, worst and median results over different periods.

Sample asset allocations 

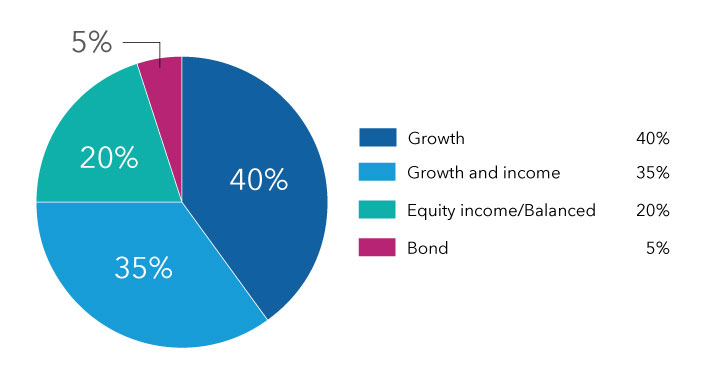
This Sample A pie chart shows how assets are allocated for an investor who will retire in 20-plus years. The allocation is: 40% to growth, 35% to growth and income, 20% to equity income/balanced, and 5% to bond.
  • Has historically provided the highest long-term returns and the most risk of the four samples.
  • Growth and growth and income assets, those with the highest typical returns and volatility, make up 75% of the portfolio.

Results based on annual investments of $2,400 over various periods

Time period

Total amount invested

Best results

Worst results

Median results

5 years

$12,000

$24,044
24.13% a year
(7/31/1982 – 7/31/1987)

$7,955
–13.39% a year
(2/29/2004 – 2/28/2009)

$16,907
11.65% a year
(8/31/2010 – 8/31/2015)

10 years

$24,000

$69,911
18.83% a year
(8/31/1977 – 8/31/1987)

$17,800
0.00% a year
(2/28/1999 – 2/28/2009)

$44,493
10.97% a year
(3/31/2008 – 3/31/2018)

30 years

$72,000

$588,162
11.51% a year
(5/31/1977 – 5/31/2007)

$251,248
7.18% a year
(3/31/1990 – 3/31/2020)

$320,804
8.45% a year
(5/31/1980 – 5/31/2010)

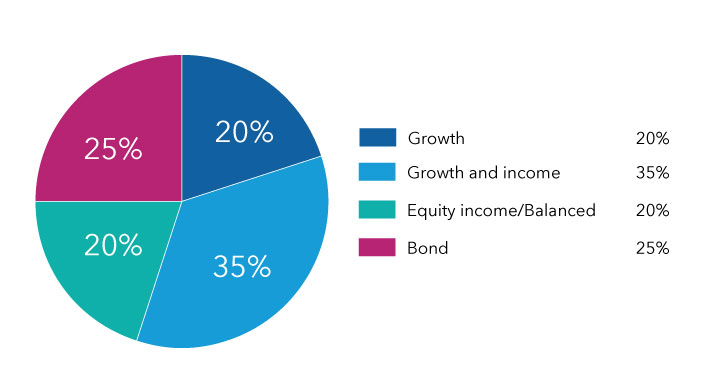
This Sample B pie chart shows how assets are allocated for an investor who will retire in 5 to 20 years. The allocation is: 20% to growth, 35% to growth and income, 20% to equity income/balanced, and 25% to bond.
  • Designed to provide growth potential along with some stability.
  • Equity income/balanced and bond asset segments can help temper the volatility of growth and growth and income assets, which still account for 55% of the portfolio.

Results based on annual investments of $2,400 over various periods

Time period

Total amount invested

Best results

Worst results

Median results

5 years

$12,000

$22,837
22.27% a year
(7/31/1982 – 7/31/1987)

$9,096
–9.09% a year
(2/29/2004 – 2/28/2009)

$16,349
10.49% a year
(6/30/2010 – 6/30/2015)

10 years

$24,000

$65,384
17.67% a year
(3/31/1977 – 3/31/1987)

$20,792
-2.62% a year
(2/28/1999 – 2/28/2009)

$40,110
9.15% a year
(1/31/1992 – 1/31/2002)

30 years

$72,000

$530,580
11.00% a year
(2/29/1976 – 2/28/2006)

$235,275
6.83% a year
(3/31/1990 – 3/31/2020)

$311,034
8.29% a year
(4/30/1979 – 4/30/2009)

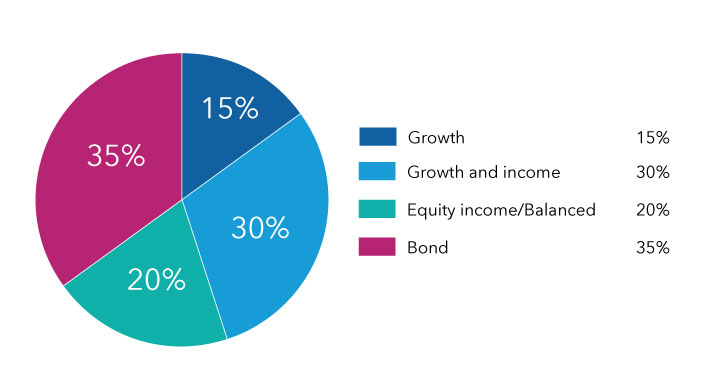
This Sample C pie chart shows how assets are allocated for an investor who will retire in 5 years or less. The allocation is: 15% to growth, 30% to growth and income, 20% to equity income/balanced, and 35% to bond.
  • Aims to reduce risk while also providing some growth.
  • Largest category is made up of bond assets (35%), usually the least volatile of the four investment types found in the samples. 

Results based on annual investments of $2,400 over various periods

Time period

Total amount invested

Best results

Worst results

Median results

5 years

$12,000

$22,202
21.25% a year
(7/31/1982 – 7/31/1987)

$9,694
–7.03% a year
(2/29/2004 – 2/28/2009)

$15,981
9.70% a year
(5/31/2010 – 5/31/2015)

10 years

$24,000

$63,327
17.11% a year
(2/28/1977 – 2/28/1987)

$22,280
-1.36% a year
(2/28/1999 – 2/28/2009)

$38,393
8.38% a year
(11/30/2007 – 11/30/2017)

30 years

$72,000

$501,223
10.71% a year
(2/29/1976 – 2/28/2006)

$227,789
6.66% a year
(3/31/1990 – 3/31/2020)

$304,358
8.18% a year
(4/30/1984 – 4/30/2014)

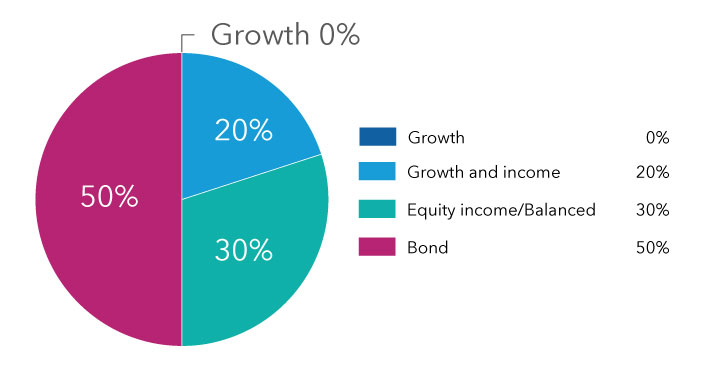
This Sample D pie chart shows how assets are allocated for an investor who is in the first 10 years of retirement. The allocation is: 0% to growth, 20% to growth and income, 30% to equity income/balanced, and 50% to bond.
  • Has provided the most stability of the four samples.
  • Most income-oriented option, with 50% in bond assets and no growth assets.
  • A 20% growth and income asset allocation provides a measure of growth potential in retirement.

Results based on annual investments of $2,400 over various periods

Time period

Total amount invested

Best results

Worst results

Median results

5 years

$12,000

$22,083
21.06% a year
(8/31/1981 – 8/31/1986)

$10,930
–3.10% a year
(2/29/2004 – 2/28/2009)

$15,336
8.29% a year
(9/30/1989 – 9/30/1994)

10 years

$24,000

$59,754
16.11% a year
(2/28/1977 – 2/28/1987)

$25,424
1.04% a year
(2/28/1999 – 2/28/2009)

$36,181
7.34% a year
(4/30/2011 – 4/30/2021)

30 years

$72,000

$451,453
10.19% a year
(2/29/1976 – 2/28/2006)

$213,803
6.32% a year
(3/31/1990 – 3/31/2020)

$286,688
7.87% a year
(6/30/1983 – 6/30/2013)

These tables are for illustrative purposes only and are not intended to provide investment advice or portray actual investment results. Individual results will vary. Hypothetical average annual returns are calculated from 1976 (the beginning of the Bloomberg U.S. Aggregate Index) to 2021 and reflect weighted averages of the results of unmanaged indexes used to represent each style category. The style categories are represented by the following indexes: Lipper Growth Funds Index (growth), Lipper Growth and Income Funds Index (growth and income); a blend of the S&P 500 with the Bloomberg  U.S. Aggregate Index weighted by their cumulative total returns at 60% and 40% respectively; this assumes the blend is rebalanced monthly (equity income/balanced); and Bloomberg U.S. Aggregate Index (bond).

These samples emphasize an investor’s time horizon and take into account the historic returns of different asset classes (growth, growth and income, equity income/balanced and bond assets). Specifically, the samples seek to balance total return and stability over time. They are designed to take on more risk (in hopes of higher returns) the further an investor is from retirement and less risk (to help preserve capital) as an investor approaches retirement. The samples seek to give investors ample equity exposure as they get closer to retirement in an effort to help them outpace inflation over an expected distribution period of 20 years or more.

When evaluating particular asset allocation samples for your individual situation, you should consider your risk tolerance, as well as other assets, income and investments (e.g., home equity, Social Security benefits, savings accounts, and interests in other qualified and nonqualified plans) in addition to any investments in your plan(s) or IRA(s).

Lipper Growth Funds Index is an equally weighted index of growth funds, as defined by each fund's related prospectus. Lipper Growth and Income Funds Index is an equally weighted index of funds that combines a growth-of-earnings orientation and an income requirement for level and/or rising dividends. The results of the underlying funds in the indexes include the reinvestment of dividends and capital gain distributions, as well as brokerage commissions paid by the funds for portfolio transactions and other fund expenses, but do not reflect the effect of sales charges, account fees or U.S. federal income taxes.

The S&P 500 Index is a market capitalization-weighted index based on the results of approximately 500 widely held common stocks. The index is unmanaged and, therefore, has no expenses.

Bloomberg U.S. Aggregate Index represents the U.S. investment-grade fixed-rate bond market. This index is unmanaged, and its results include reinvested dividends and/or distributions but do not reflect the effect of sales charges, commissions, account fees, expenses or U.S. federal income taxes.

Past results are not predictive of results in future periods.
Investments are not FDIC-insured, nor are they deposits of or guaranteed by a bank or any other entity, so they may lose value.
Investors should carefully consider investment objectives, risks, charges and expenses. This and other important information is contained in the fund prospectuses and summary prospectuses, which can be obtained from a financial professional and should be read carefully before investing.
Investing outside the United States involves risks, such as currency fluctuations, periods of illiquidity and price volatility. These risks may be heightened in connection with investments in developing countries.
The return of principal for bond portfolios and for portfolios with significant underlying bond holdings is not guaranteed. Investments are subject to the same interest rate, inflation and credit risks associated with the underlying bond holdings.
Lower rated bonds are subject to greater fluctuations in value and risk of loss of income and principal than higher rated bonds.
Small-company stocks entail additional risks, and they can fluctuate in price more than larger company stocks.
There have been periods when the results lagged the index(es) and/or average(s). The indexes are unmanaged and, therefore, have no expenses. Investors cannot invest directly in an index. Results for Lipper indexes/averages do not reflect sales charges. Lipper categories are dynamic and averages may have few funds, especially over longer periods. Lipper indexes track the largest mutual funds (no more than 30), represented by one share class per fund, in the corresponding Lipper category. Lipper averages reflect the current composition of all eligible mutual funds (all share classes) within a given category. To identify the number of funds included in the Lipper category for each fund's lifetime, please refer to the quarterly statistical update, available on our website.
Source: Bloomberg Index Services Limited. BLOOMBERG® is a trademark and service mark of Bloomberg Finance L.P. and its affiliates (collectively "Bloomberg"). Bloomberg or Bloomberg's licensors own all proprietary rights in the Bloomberg Indices. Neither Bloomberg nor Bloomberg's licensors approves or endorses this material, or guarantees the accuracy or completeness of any information herein, or makes any warranty, express or implied, as to the results to be obtained therefrom and, to the maximum extent allowed by law, neither shall have any liability or responsibility for injury or damages arising in connection therewith.
Each S&P Index ("Index") shown is a product of S&P Dow Jones Indices LLC and/or its affiliates and has been licensed for use by Capital Group. Copyright © 2024 S&P Dow Jones Indices LLC, a division of S&P Global, and/or its affiliates. All rights reserved. Redistribution or reproduction in whole or in part is prohibited without written permission of S&P Dow Jones Indices LLC.
All Capital Group trademarks mentioned are owned by The Capital Group Companies, Inc., an affiliated company or fund. All other company and product names mentioned are the property of their respective companies.
Investment results assume all distributions are reinvested and reflect applicable fees and expenses.
Use of this website is intended for U.S. residents only.
Capital Client Group, Inc.
This content, developed by Capital Group, home of American Funds, should not be used as a primary basis for investment decisions and is not intended to serve as impartial investment or fiduciary advice.