Japan

Japan: Will reforms unlock stock valuations?

A significant shift is underway in Japan, and equity markets are taking notice. It may not have been obvious to U.S. dollar-based investors, but in local currency terms, Japanese equities as measured by the MSCI Japan Index have climbed 25% year to date (as of August 31, 2023).


The wave of optimism has been driven by two key factors: inflation and reforms. While inflation has been challenging for many developed economies, it’s a welcome sign in Japan, which has been battling deflation for three decades. Sustained and healthy inflation could change the mindset in Japan from saving to investing.


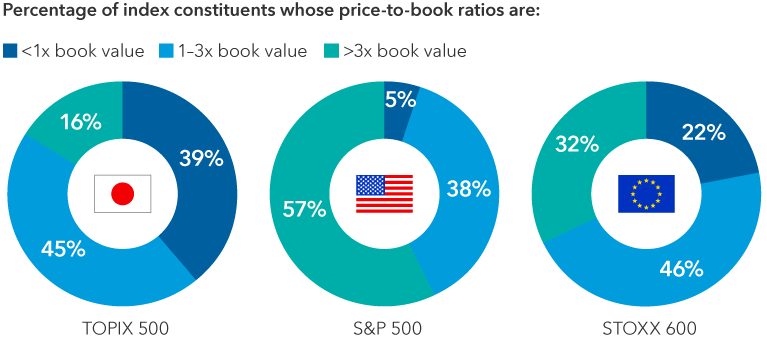
In terms of reforms, there is tremendous emphasis on improving corporate governance, and companies are focusing more on shareholder returns. In a recent move, the Tokyo Stock Exchange asked all listed companies to enact policies to improve profitability, long-term returns and valuations. About 39% of companies in the TOPIX (an index comprising Japanese stocks) trade below book value, compared to just 5% for companies in the S&P 500 Index.

Book values are depressed in Japan

Bar chart compares price-to-book values of companies in global benchmarks. The percentage of companies in the TOPIX 500 index that trade below one times book value is 39%. The percentage trading between one and three times book value is 45%. The percentage trading above three times book value is 16%. By comparison, the percentage of companies in the S&P 500 index trading below one times book value is 5%. The percentage trading between one and three times book value is 38%. The percentage trading above three times book value is 57%. The percentage of companies in the STOXX 600 index trading below one times book value is 22%. The percentage trading between one and three times book value is 46%. The percentage trading above three times book value is 32%.

Sources: Capital Group, FactSet, Refinitiv Datastream, Standard & Poor’s, STOXX, TOPIX. The price-to-book ratio is the ratio of a company's publicly traded share price to its equity value per share. As of August 18, 2023.

Many Japanese companies have also fallen behind on converting information into digital formats and are now making concerted efforts to catch up, which could boost productivity. Put together, these steps can create a virtuous circle with a potentially positive impact on corporate earnings and valuations.  


The economic transformation is not entirely new. It began around 10 years ago with Abenomics — then-Prime Minister Shinzo Abe’s program aimed at reinvigorating Japan’s stagnant economy through a combination of monetary policy, government spending and structural reforms. But investor optimism has fluctuated. That said, in our recent travels through Japan, where we and many Capital Group portfolio managers and analysts met with various policymakers and corporate managements across many industries, we observed that the desire for change is more palpable today than it has been in the prior two decades.


Some other factors that support our positive outlook: valuations appear reasonable compared to other markets, the political situation is relatively stable, foreign investment in manufacturing is coming back and tourism has rebounded since COVID-19 restrictions were lifted. Interest rates also remain low relative to other developed markets.


Against this backdrop, we have additional views on Japan and areas of the market that may present potential investment opportunities.

1. Japanese companies occupy niches in key industries


For all its economic woes, Japan has created a tremendous competitive advantage in certain industries. Japanese firms have developed unique technologies in niche markets from which they’ve been able to build durable businesses with highly defensible moats. These include areas like industrial automation equipment, sensors, inspection tools for semiconductor manufacturing, energy-efficient air conditioning systems and battery technology. Medical devices and pharmaceuticals are other areas where Japanese companies have built market share.


These types of companies should have long product cycles as we see an industrial renaissance in developed economies and ongoing industrialization in emerging markets.


SMC, for instance, is a leader in specialized components for automation equipment and semiconductor production. Shin-Etsu is the world’s largest maker of silicon wafers for semiconductor products, while TDK is one of the largest manufacturers of high-end batteries and specialized circuits used in electric vehicles.

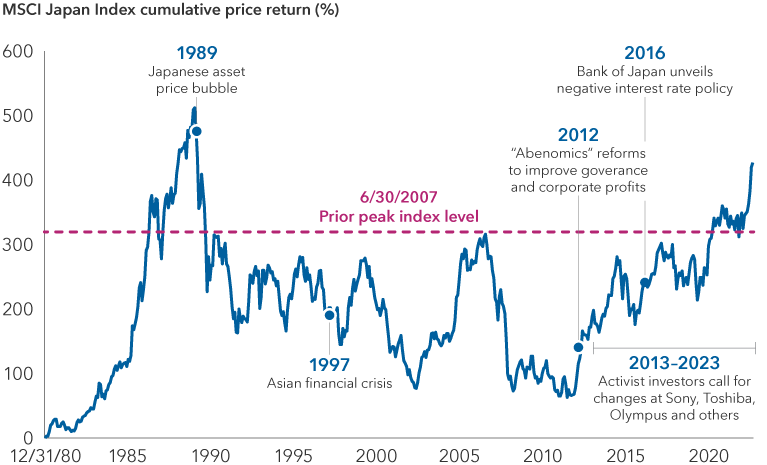
Japanese stocks trade at highest levels since early 1990

Chart shows cumulative price return of MSCI Japan Index from December 30, 1980 to July 31, 2023, which was 427%. During the 1980s, the index experienced a sharp rise and peaked in December 1989 with a gain of 512%. It then experienced a downward slide through March of 2003. The index then climbed to a new high by June 2007 and then began a multiyear downward slide that lasted till mid-2012. The index began to rise as the government unveiled corporate reforms and activist shareholders pressured companies. It broke past its June 2007 peak in 2020 and continued to climb higher. Chart also shows a timeline of events. 1989 = Japanese asset price bubble. 1997 = Asian financial crisis. 2012 = Abenomics reforms to improve governance and corporate profits. 2016 = Bank of Japan unveils negative interest rate policy. 2013 to 2023 = Activist investors call for changes at Sony, Toshiba, Olympus and others.

Sources: Capital Group, MSCI, RIMES. Cumulative price returns shown from December 31, 1980, to July 31, 2023. Returns shown in Japanese yen. The cumulative return is the total change in the investment price over a set time. As of July 31, 2023. Past results are not predictive of results in future periods.

2. Corporate reforms are gaining traction


Many Japanese companies have excelled in cutting-edge areas of science and engineering. However, equity prices in most cases have been hurt by subpar corporate governance. A number of companies have hoarded cash, created insular corporate structures, and operated conglomerates (large and small) that have not always been efficient or profitable.


Since the start of Abenomics in 2012, corporate Japan has been on a journey to improve profitability, capital allocation and corporate governance. But while progress has been painfully slow, in part due to Japan’s cautious approach to change, there is a stronger sense of urgency to address cash-heavy balance sheets and inefficient business lines.


We now believe there is greater alignment between companies and the government to improve governance standards, business models and capital structures. Over the next few years, this may well result in improved shareholder returns through divestitures, higher dividend payouts and share buybacks.


In our meetings with officials from the Ministry of Economy, Trade and Industry and the  Financial Services Agency, they highlighted how company book values were much lower than those in the U.S. and Europe, and that this needed to be fixed. They also voiced support for more acquisitions between domestic companies.

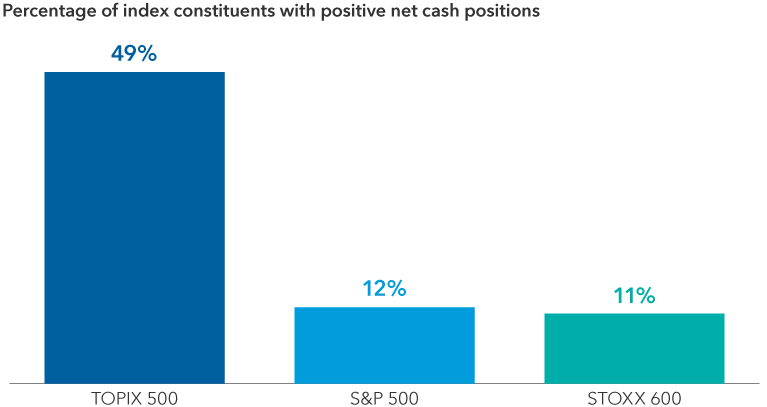
Japan Inc. is cash heavy

Bar compares net cash positions across three equity benchmarks. The percentage of index constituents with positive net cash positions listed on the TOPIX 500, a stock index of Japanese companies, was 49%.  The percentage of index constituents with positive net cash positions listed on the S&P 500, a stock index of U.S. companies, was 12%. The percentage of index constituents with positive net cash positions listed on the STOXX 600, a stock index of European companies, was 11%.

Sources: Capital Group, FactSet, Refinitiv Datastream, Standard & Poor's (U.S.), STOXX (Europe), TOPIX (Japan). Net cash reflects the difference between the cash and short-term securities reported on a company's balance sheet and its outstanding debt. As of August 18, 2023.

3. Potential for M&A and consolidation to add value


More specifically, the government’s recent proposal addressing governance standards for mergers and acquisitions would make it more difficult for boards to reject reasonable takeover offers without justification.


This would represent monumental change. We believe merger-and-acquisitions activity has the potential to unlock the biggest hidden value remaining in Japan, which is the mountain of cash doing nothing across a multitude of corporate balance sheets.


At the height of their influence and power in the late 1980s, many Japanese companies decried the ruthless takeover environment in the United States. They placed more emphasis on operating large and stable businesses. Japan favored lifetime employment, seniority-based compensation and shared salary cuts over job cuts. 


In sum, we don’t expect changes to happen overnight. They will likely be gradual, but getting ahead of those opportunities as investors is important.

4. Transforming legacy businesses may unlock shareholder value


Some companies have been reinventing themselves by shedding noncore businesses and narrowing their business focus. In others, there is new leadership driving change or existing managements and boards that seem willing to make changes. 


Here are several examples:
 

  • Pharmaceuticals firm Daiichi-Sankyo was once hampered by poor product development, a portfolio of undifferentiated drugs and the unsuccessful acquisition of India’s largest generic drugmaker. Daiichi shifted course several years ago, cutting many of its R&D programs to focus on building what has become a promising pipeline of novel cancer treatments. It now ranks as one of Japan’s most valuable companies by market capitalization, boasts a differentiated antibody drug conjugate (ADC) platform and a blockbuster drug used to treat breast cancer.
     
  • Toppan is looking to address its cash-heavy balance sheet. Its new president has been deemphasizing the company’s commercial printing business in favor of specialty packaging. Toppan has launched a large share buyback program, shrunk the size of its board and introduced a target for return on invested capital. It also sold equity stakes in two of its businesses.
     
  • Industrial conglomerate Hitachi has been shrinking its portfolio, divesting interests in its construction machinery, metals and auto parts businesses. The company aims to pay out approximately 50% of its net income in dividends and share buybacks.


Broadly speaking, we think these kinds of self-help stories can help support long-term growth.

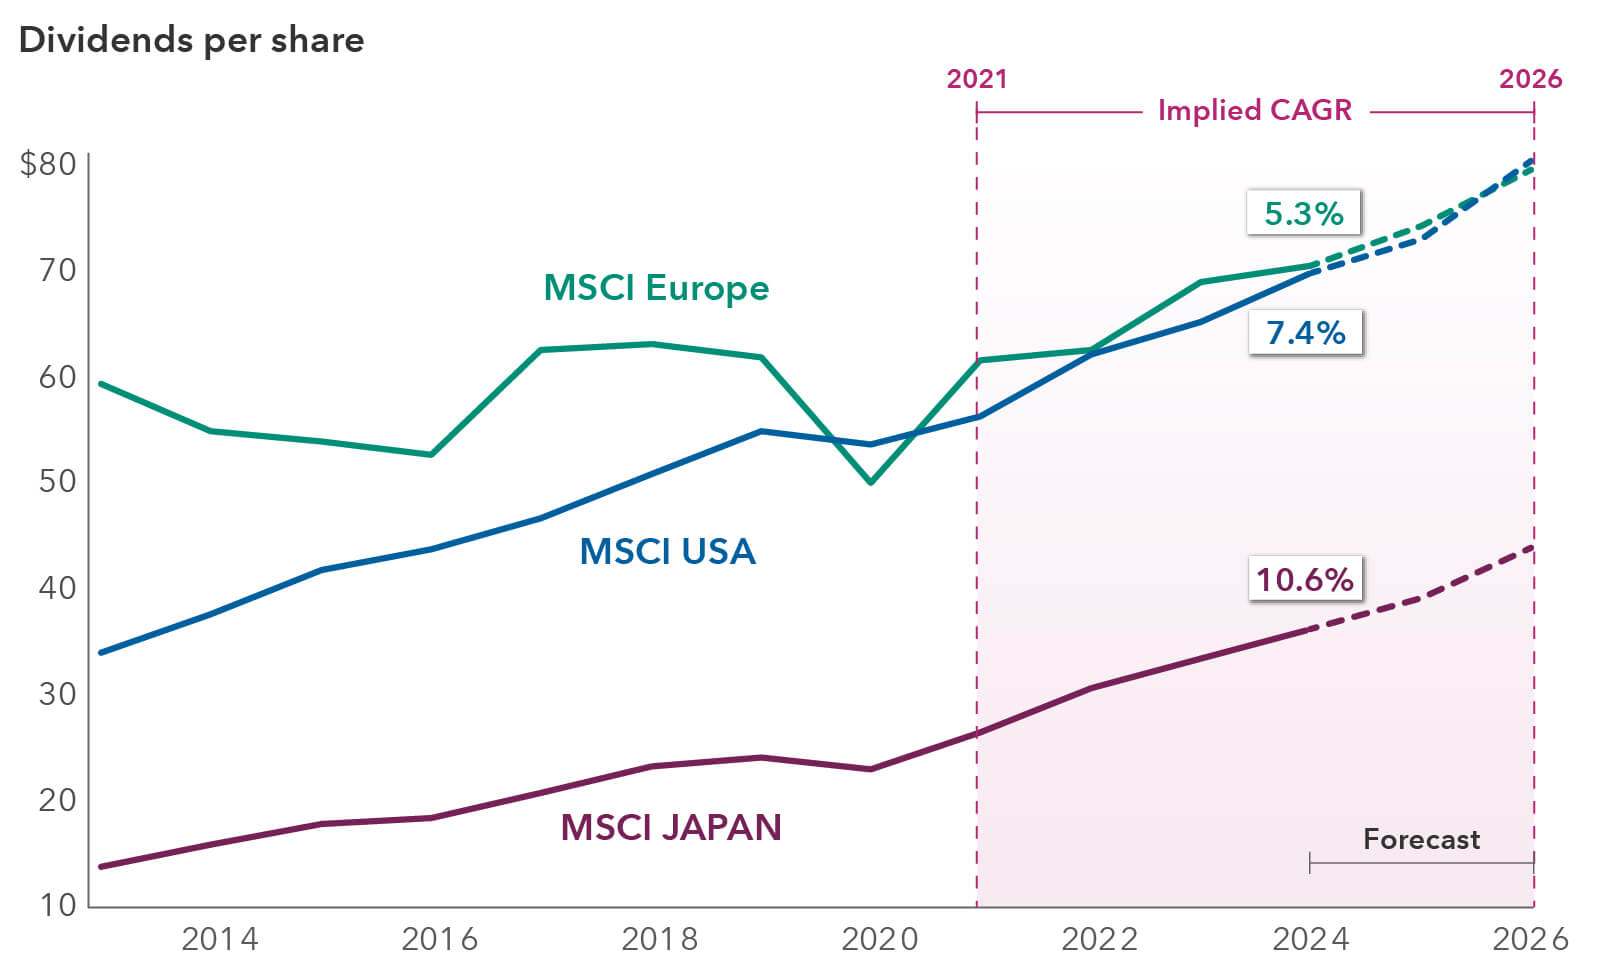
Dividend growth in Japan looks encouraging

The line chart illustrates the projected growth rates of dividends per share for three stock market indices: MSCI Europe, MSCI USA and MSCI Japan. The x-axis lists the years from 2013 to 2026, with 2024 through 2026 based on consensus estimates. The y-axis shows dividends per share in dollars. From 2021 to 2026, the chart shows implied compound annual growth rates (CAGR). For the top line on the chart, MSCI Europe has a CAGR of 5.3%. MSCI USA’s CAGR is 7.4%, and MSCI Japan’s is 10.6%. All three lines have increasing dividend trends during the specified period.

Source: FactSet. Dividends reflect the aggregate amount paid by companies on a per-share basis in the respective indices. Data for 2023–2025 is based on consensus estimates as of May 31, 2023. Compound annual growth rate is the mean growth rate of an investment over a specified period of time longer than one year.

5. Spending on enterprise software should grow amid digital transformation


Japan is playing catch-up when it comes to moving into the digital age. The pandemic exposed this weakness when the government struggled to distribute emergency payments and as workers were challenged to work remotely. 


Many Japanese companies need to upgrade their legacy computer systems, which we believe foreshadows a rise in information technology investment. Given the country’s aging demographics and persistent labor shortage concerns, businesses will need to improve productivity and increase automation. OBIC is one company that has benefited from this trend; it has seen sales for its computer cloud software grow for the past several years.


Meanwhile, Nomura Research Institute (NRI) is an example of how big companies are seeking to harness the productivity benefits of artificial intelligence (AI), which NRI is using to help large enterprises organize their proprietary data in a format that can train very large datasets for AI.

6. Geopolitical tensions are reviving manufacturing investments


Japan is a country with relative social stability, and as an export-driven economy, it has a proven and reliable manufacturing base. With growing risks to doing business in China, Japan has been attracting more foreign investment. Manufacturing costs are also more reasonable after decades of deflation and the weaker yen.


One case worth watching is the construction of Taiwan Semiconductor’s plant in Kumamoto, where it reportedly may build a second facility as well. Japan’s government has brought in more than $14 billion in planned investment since 2021 from companies in the U.S., Europe, South Korea and Taiwan. Among those are South Korea-based Samsung Electronics and U.S.-based Micron Technology, both leaders in the development of memory chips.


We think Japan is in a position to capture some higher-end manufacturing as multinationals seek to diversify their supply chains in Asia. Countries like Vietnam and Cambodia can make items like sneakers and toys but lack the necessary expertise and infrastructure for more technologically sophisticated products. If this trend continues, it would be a sharp reversal from the past and could potentially reinflate the economy and provide a boost to regional business hubs.

7. A rebound in the yen should be additive to stock returns


A weakening yen has eroded Japanese stock returns for U.S. dollar-based investors. The Japanese currency weakened from 103 yen to the dollar at the end of 2020 to the current level above 145 yen to the dollar. The Bank of Japan’s (BOJ’s) bond-buying policy of depressing yields, known as yield curve control, combined with an anemic economy, have weighed on the currency.


Over the last couple of months, the BOJ has acknowledged that inflationary pressures have risen and adjusted monetary policy to allow 10-year yields to rise to 1.0%. 


In the view of our Japan economist Anne Vandenabeele, it’s likely that inflation will persist above the BOJ’s target of 2% over the next 12 to 18 months. The central bank could therefore be in a position to end its negative interest rate policy next year and further loosen its controversial yield curve control policy as well (although the BOJ will likely continue to buy bonds to manage the rise in yields). This chain of events is expected to lead to the yen plateauing at these levels, or even strengthening from here, although much will also depend on other central banks and U.S. rates, in particular.


And a stronger yen should benefit dollar-based investors purely from the currency translation effect on portfolios.


From a fundamental perspective, many of Japan’s major exporters such as the auto companies, have diversified their manufacturing bases with factories around the world. As such, the impact of a strengthening currency on corporate earnings should be much more muted than in the past.

8. Loss of reform momentum and a global downturn are risks


We’ve seen similar market rallies fizzle over the past decade. The introduction of Abenomics and subsequent corporate reforms in 2014 and 2015, along with the growing presence of U.S. activist hedge funds in Japan, have led to bursts of exuberance.


While positive developments are taking shape, we are taking a measured approach. Foreign investors make up a large portion of Japan’s equity market. The country’s economy is export-driven and heavily focused on industrial production. If the global economy weakens or reforms lose steam, stocks could come under pressure in a risk-off environment.


Nevertheless, we are currently more positive on Japan than we have been over the past two decades. The number of portfolio managers and analysts who have visited Japanese companies continues to grow, and the discussion on where the opportunities are is robust across equity groups and portfolios.

EUC

Eu-Gene Cheah is an equity portfolio manager with 26 years of industry experience (as of 12/31/23). He holds an MBA from INSEAD, France, and a degree in clinical medicine from Oxford University, where he was a Rhodes Scholar.

AIH

Akira Horiguchi is an equity portfolio manager with 30 years of industry experience (as of 12/31/23). He holds a bachelor’s degree in economics from Tokyo University. He is also a chartered member of the Security Analysts Association of Japan. 

DCEC

Dickon C. Corrado is an equity portfolio manager with 24 years of industry experience (as of 12/31/23). He holds an MBA from the University of North Carolina, a master’s degree in international economics from Fudan University in Shanghai and a bachelor’s degree in economics and engineering science from Vanderbilt University. 

Emily-Liao-color-600x600

Emily Liao is an equity investment director with 20 years of industry experience (as of 12/31/23). She holds a bachelor's degree in sociology from the University of Chicago.


The book value of a stock is theoretically the amount of money that would be paid to shareholders if the company was liquidated and paid off all of its liabilities. 


All indexes are unmanaged, and their results include reinvested distribution but do not reflect the effect of sales charges, commissions, account fees, expenses, or U.S. federal income taxes.


The MSCI Europe Index captures large-and mid-cap representation across 15 developed market countries in Europe. With 424 constituents, the index covers approximately 85% of the free float-adjusted market capitalization across the European developed markets equity universe.


The MSCI Japan Index is designed to measure the performance of the large-and mid-cap segments of the Japanese market. With 237 constituents, the index covers approximately 85% of the free float-adjusted market capitalization in Japan.


The MSCI USA Index is designed to measure the performance of the large-and mid-cap segments of the US market. With 627 constituents, the index covers approximately 85% of the free float-adjusted market capitalization in the US.


S&P 500 Index is a market-capitalization-weighted index based on the results of 500 widely held common stocks.


The S&P 500 (“Index”) is a product of S&P Dow Jones Indices LLC and/or its affiliates and has been licensed for use by Capital Group. Copyright © 2023 S&P Dow Jones Indices LLC, a division of S&P Global, and/or its affiliates. All rights reserved. Redistribution or reproduction in whole or in part is prohibited without written permission of S&P Dow Jones Indices LLC.


The STOXX 600 Index represents large-, mid- and small-capitalization companies across 17 countries of the European region: Austria, Belgium, Denmark, Finland, France, Germany, Ireland, Italy, Luxembourg, the Netherlands, Norway, Poland, Portugal, Spain, Sweden, Switzerland and the United Kingdom.


The TOPIX 500 Index is a capitalization-weighted index designed to measure the performance of the 500 most liquid stocks with the largest market capitalization that are members of the TOPIX Index.

Investments are not FDIC-insured, nor are they deposits of or guaranteed by a bank or any other entity, so they may lose value.
Investors should carefully consider investment objectives, risks, charges and expenses. This and other important information is contained in the fund prospectuses and summary prospectuses, which can be obtained from a financial professional and should be read carefully before investing.
Investing outside the United States involves risks, such as currency fluctuations, periods of illiquidity and price volatility. These risks may be heightened in connection with investments in developing countries.
There have been periods when the results lagged the index(es) and/or average(s). The indexes are unmanaged and, therefore, have no expenses. Investors cannot invest directly in an index.
MSCI has not approved, reviewed or produced this report, makes no express or implied warranties or representations and is not liable whatsoever for any data in the report. You may not redistribute the MSCI data or use it as a basis for other indices or investment products.
Statements attributed to an individual represent the opinions of that individual as of the date published and do not necessarily reflect the opinions of Capital Group or its affiliates. This information is intended to highlight issues and should not be considered advice, an endorsement or a recommendation.
All Capital Group trademarks mentioned are owned by The Capital Group Companies, Inc., an affiliated company or fund. All other company and product names mentioned are the property of their respective companies.
Use of this website is intended for U.S. residents only. Use of this website and materials is also subject to approval by your home office.
Capital Client Group, Inc.
This content, developed by Capital Group, home of American Funds, should not be used as a primary basis for investment decisions and is not intended to serve as impartial investment or fiduciary advice.