info
On Christmas Day, the New York Stock Exchange and Capital Group’s U.S. offices will be closed.

In observance of the Christmas Day federal holiday, the New York Stock Exchange and Capital Group’s U.S. offices will close early on Tuesday, December 24 and will be closed on Wednesday, December 25. On December 24, the New York Stock Exchange (NYSE) will close at 1 p.m. (ET) and our service centers will close at 2 p.m. (ET)

U.S. Equities

Small caps may have reached an inflection point

Small-cap stocks, long overlooked in favor of large caps, are staging a comeback and may be at an inflection point after years of lagging their larger peers. Small caps (as measured by the Russell 2000 Index) have surged to three-year highs, and we think the outlook is getting more constructive on several fronts.


Here’s why: For one, the U.S. economy remains strong with the prospect of further interest rate cuts and a more deregulatory environment. On the earnings front, growth is poised to reaccelerate for smaller companies, following a rough patch in recent years. Also, initial public offering (IPO) activity is picking up, which could create new investment opportunities amid pent up demand from private equity investors to exit investments. Plus, there is a wide valuation gap with large caps. 


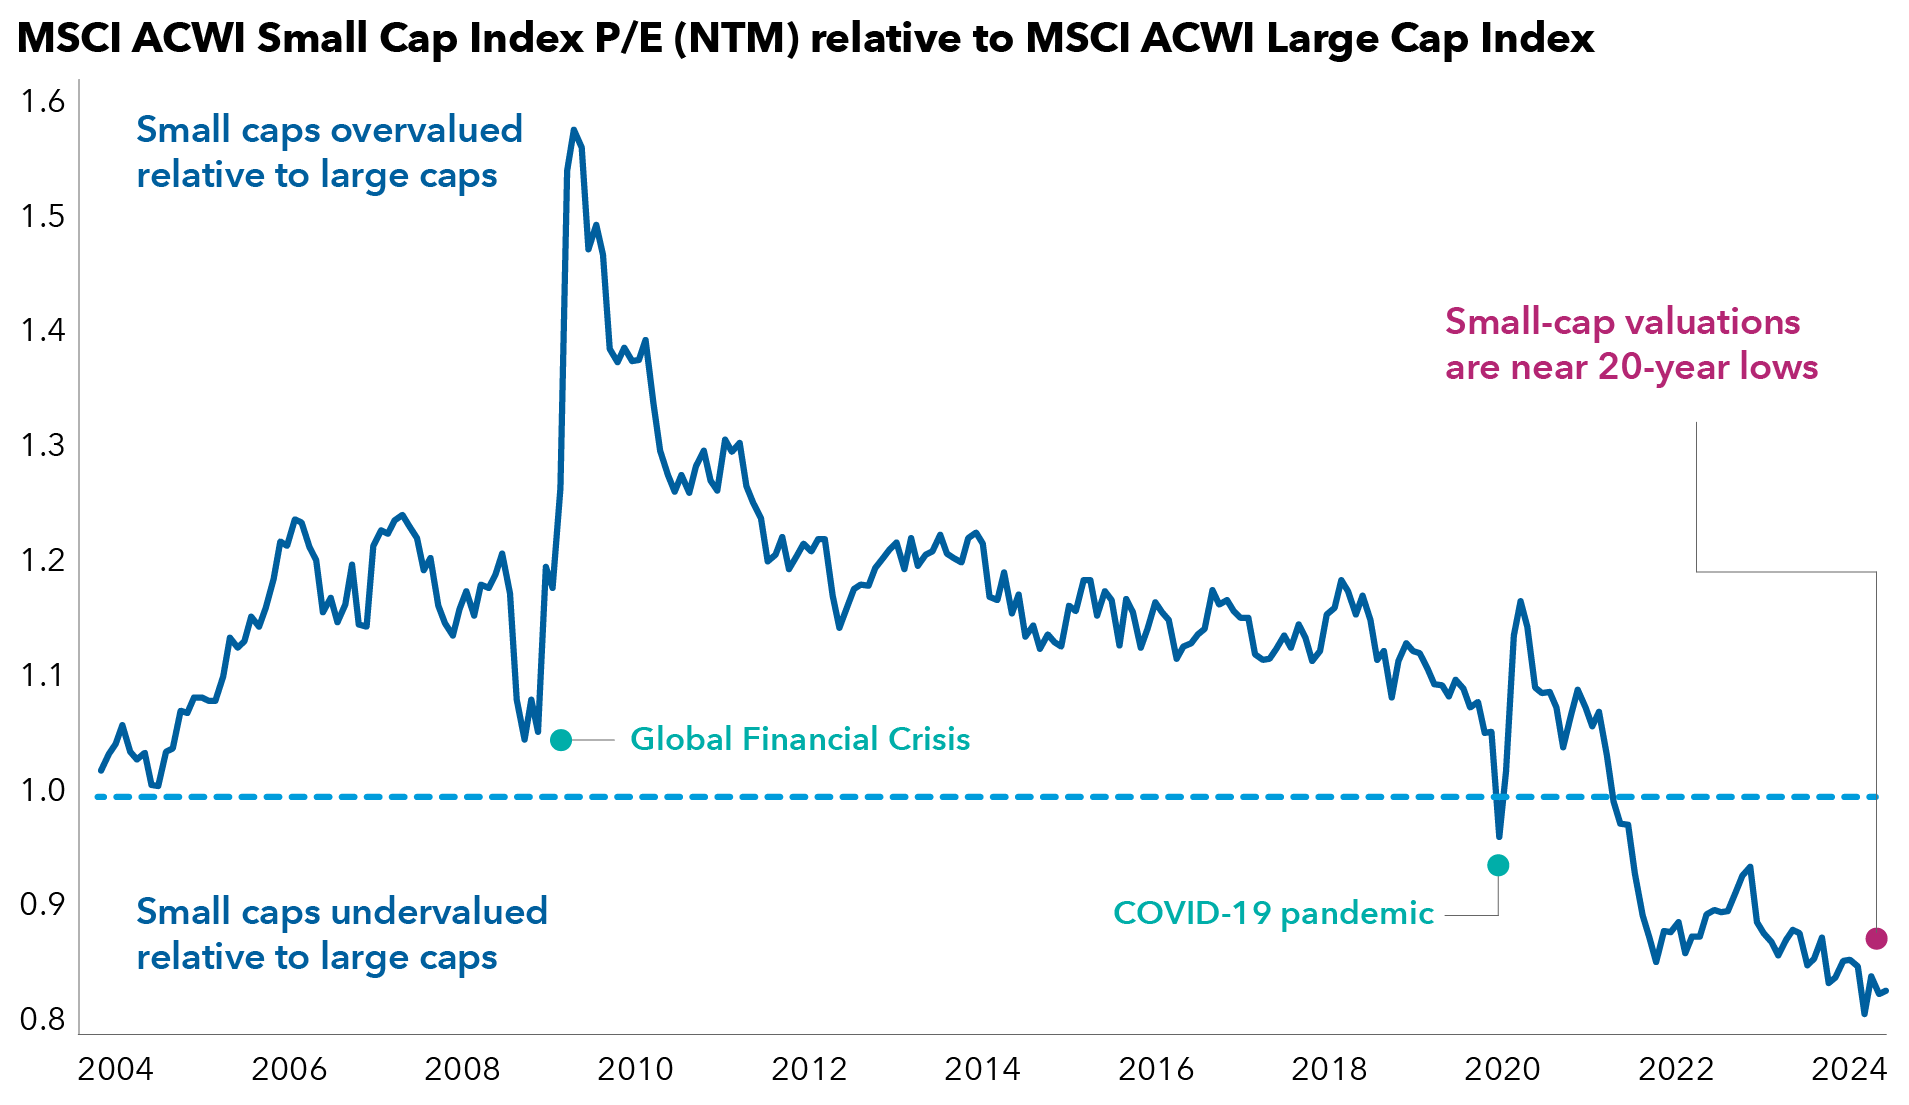
On a forward price-to-earnings basis, small-cap stocks globally trade at their lowest levels in nearly 20 years relative to large companies. Of course, quality varies in the small cap universe and returns have varied the past 12 months across the world, underscoring the eclectic nature of the asset class and idiosyncratic opportunities. 

Valuation gap is hard to ignore

A line chart compares the MSCI All Country World Index (ACWI) Small Cap Index price-to-earnings (P/E) ratio over the next 12 months (NTM) to the MSCI ACWI Large Cap Index from December 31, 2003, to May 31, 2024. The y-axis shows relative P/E ratios ranging from 0.8 to 1.6, and the x-axis represents years. The line starts near 1.0 in 2004 and fluctuates, dipping back toward 1.0 during the Great Financial Crisis, and peaking at 1.57 around 2009. The line then declines with a significant dip during the COVID-19 pandemic, reaching its lowest point near 2024, marked “Small-cap valuations are near 20-year lows.” Two annotations indicate where small caps were overvalued relative to large caps (above 1.0) and periods where they were undervalued (below 1.0).

Sources: Capital Group, FactSet, MSCI. As of September 30, 2024. P/E = price-to-earnings. The y-axis represents the ratio between the P/E of MSCI ACWI Small Cap Index and the P/E of the MSCI ACWI Large Cap Index.

Here is a deeper look at the potential catalysts for change and the challenges. 

1.   It’s not unusual to see extended periods of large-cap equity leadership

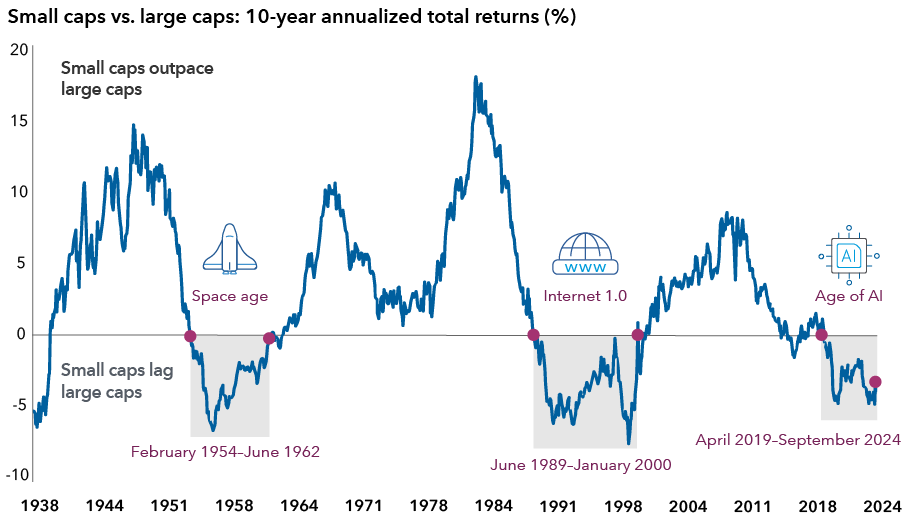
First off, it’s obviously been a frustrating period for small cap investors. For much of the past decade, small caps have trailed large caps. We would point out that this dynamic has gone back and forth since the 1930s.


Interestingly, previous cycles of outsized leadership for small caps followed technological leaps that impacted society and spawned new businesses.


Go back to the Space Race of the 1950s–1960s between the USSR and the United States. Think of the development of the internet and broadband networking capacity in the mid-to-late 1990s, rapid smartphone adoption after 2008 and the acceleration in cloud computing after 2012. In our view, artificial intelligence (AI) is likely to be the next catalyst.

Small cap declines have been relatively modest

A line chart compares the total returns of small-cap and large-cap stocks from 1938 to 2024. The y-axis shows the 10-year annualized percentage returns, ranging from negative 10% to 20%, and the x-axis shows years. Returns above zero are in a section labeled “Small caps outpace large caps,” and returns beneath are labeled “Small caps lag large caps.” The line representing small-cap stocks fluctuates but shows relatively modest declines, dipping to lows of about 6.5% during the Space Age from February 1954 to June 1962, the early internet era, from June 1989 to January 2000, and during a period labeled the age of AI, April 2019 to September 2024 in the chart. Small cap 10-year annualized total returns peak to about 15% in the late 1940s, around 12% in the late 1960s, near 20% in the mid-1980s and to around 10% in the early 2010s.

Sources: Capital Group, Ibbotson, Morningstar, Standard and Poor's. Small cap returns are represented by monthly total returns for the Ibbotson Small Company Stocks Index; large cap returns are represented by monthly total returns for the S&P 500 Index. Data as of September 30, 2024.

With that in mind, it can be prudent to be positioned earlier rather than later, for these leadership changes in areas of the equity market. Moves in smaller stocks can be more swift than larger ones, since small caps are often less liquid and more volatile.


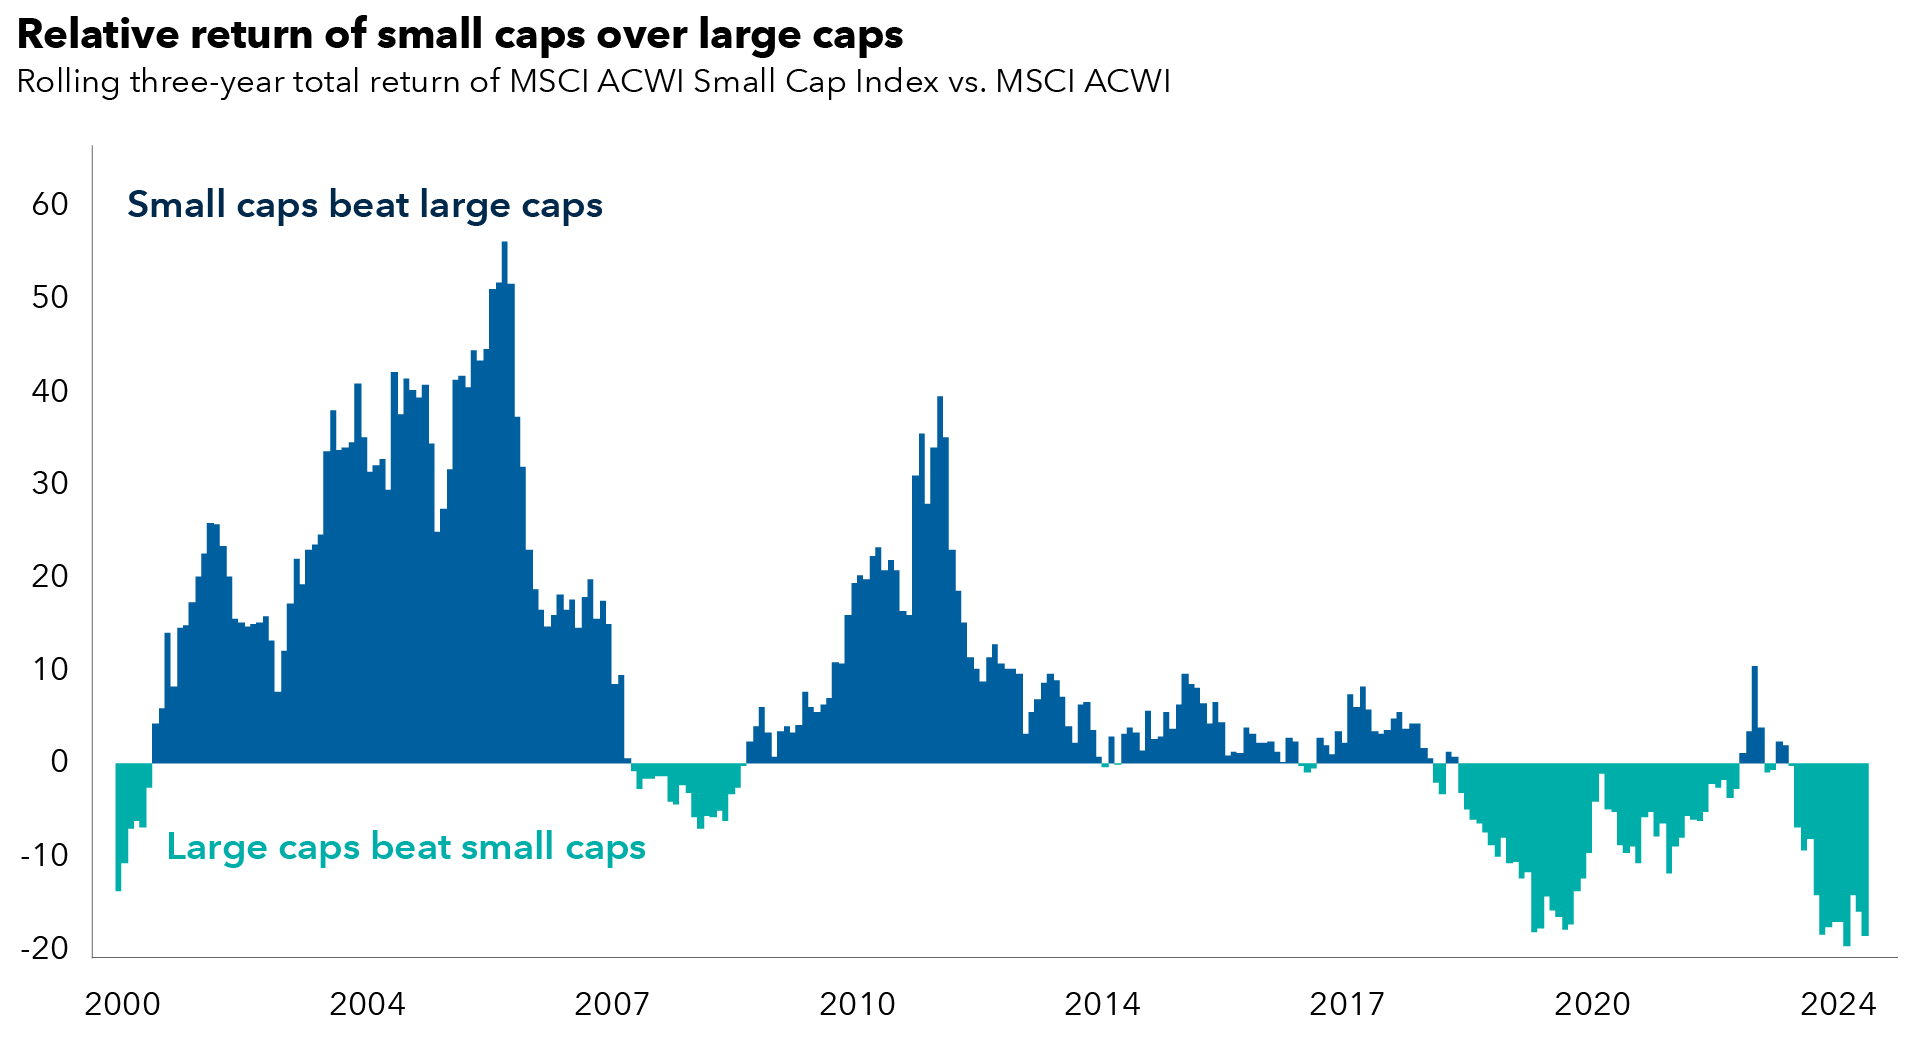
Furthermore, on a global basis, history also suggests small caps can pack a punch. As the chart shows, they have outpaced large caps close to 70% of the time in three-year rolling periods since 2000, making the asset class an important source of global equity returns. 

Global small caps have historically outpaced large caps

Chart shows the relative return of the MSCI ACWI Small Cap Index versus the MSCI ACWI on three-year rolling periods from December 29, 2000, to December 31, 2023. Overall, small cap stocks have outpaced large caps 70% of the time. The longest periods of outperformance were from June 2001 through November 30, 2007, and July 2009 through April 30, 2014. The longest stretch of underperformance for small caps relative to large caps was from March 2019 through December 2022.

Sources: Capital Group, MSCI, Refinitiv. As of September 30, 2024.

2.   Direction of U.S. economy and rate policy appear constructive

Small caps struggled with a two-year rate hiking cycle that raised their debt financing costs, as well as growing concerns the U.S. was headed for a recession. The outlook looks more favorable on both of these fronts. Plus, inventory imbalances in certain industries that hurt earnings for smaller companies in 2022 and 2023 have improved.


The direction of the U.S. economy suggests a more constructive backdrop for economically sensitive small caps. Our economist Jared Franz believes the U.S. economy is shifting back to mid-cycle, rather than exhibiting late-cycle conditions, which often foreshadow a recession. He likens it to the 2008 movie The Curious Case of Benjamin Button, where the title character played by Brad Pitt ages in reverse — from an old man to a young child.      


A mid-cycle economy is generally characterized by rising corporate profits, accelerating credit demand, softening cost pressures and a shift toward neutral monetary policy. If this scenario plays out like the movie script, proposed initiatives under the Trump administration (e.g., lower corporate taxes, deregulation) could be tailwinds for U.S. small caps.


It does come with a caveat. Stronger growth for the U.S. economy could bring higher inflation, meaning the Fed may be forced to either pause its current rate cuts or hike depending on what impact the policies have on the economy. 

3.   Earnings growth will have to come through 

For smaller companies to close both the valuation and market leadership gap with large caps, earnings growth has to come through. After all, fundamentals ultimately help sustain stock price gains. So far, the picture looks encouraging.


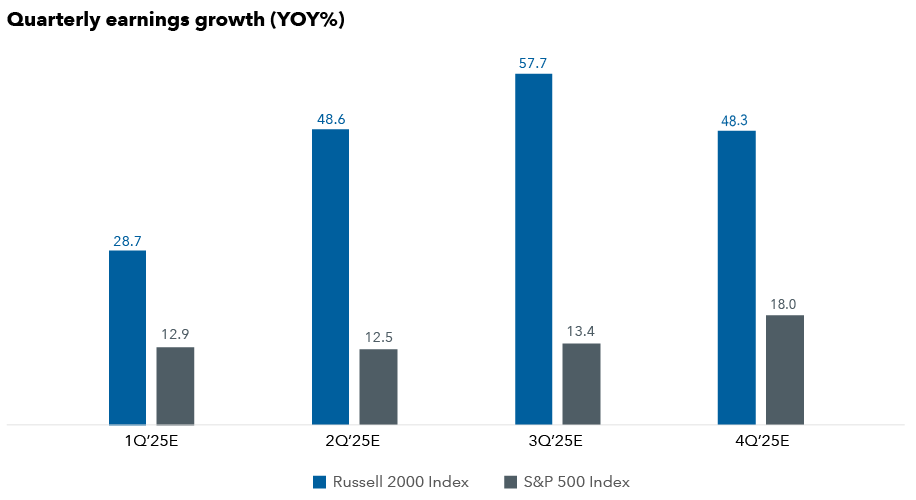
Earnings are projected to improve over the next four quarters for companies that comprise the Russell 2000 Index, based on consensus estimates compiled by data provider LSEG.

Small cap earnings are on the rise

The chart illustrates a steady rise in earnings for small-cap companies within the Russell 2000 Index against the S&P 500 Index over the next four quarters. It shows a gradual increase in projected earnings: 28.7, 48.6, 57.7, 48.3 from 1Q 2025 through 4Q 2025, respectively. The growth dwarfs the projected year-over-year quarterly earnings growth of the S&P 500 as follows: 12.9, 12.5, 13.4 and 18.0 respectively.

Source: LSEG I/B/E/S. Data as of November 29, 2024. Estimates from first quarter to fourth quarter of 2025. E = estimate.

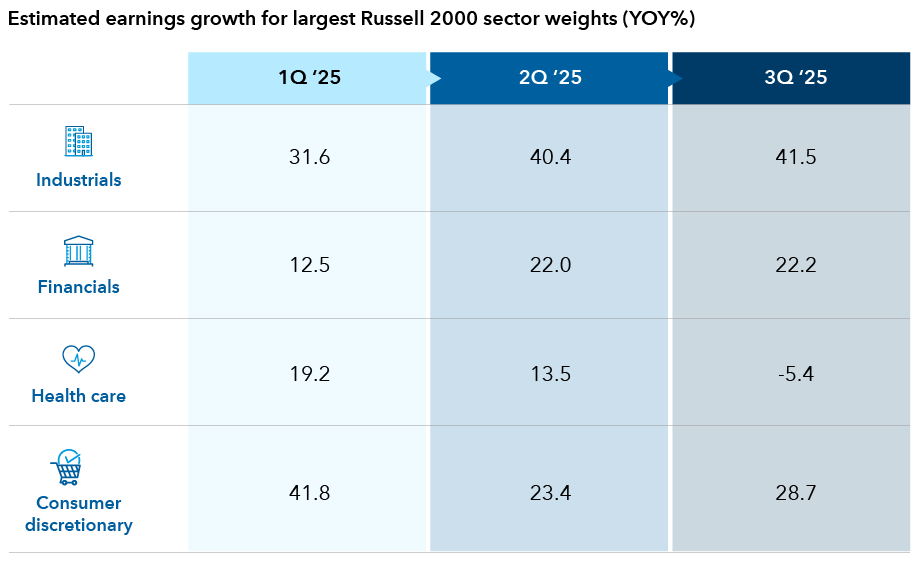
What’s more, earnings growth is projected to be mostly robust for the four largest sector weights in the Russell 2000: industrials, financials, health care and consumer discretionary. These are areas where we believe certain companies can be bolstered by stronger U.S. growth, a more normal interest rate environment and a revival of domestic manufacturing. 

Earnings growth projected to increase in key areas

The table illustrates projected year-over-year percentage changes in earnings for four sectors: industrials, financials, health care and consumer discretionary over three quarters, beginning with 1Q 2025 through 3Q 2025. Industrials show a projected rise: 31.6%, 40.4% and 41.5%, respectively. Financials are projected to rise over the period: 12.5%, 22.0% and 22.2%, respectively. Health care is projected to decline: 19.2%, 13.5% and -5.4%, respectively.  Consumer discretionary is projected to rise over the period: 41.8%, 23.4% and 28.7%, respectively.

Source: LSEG I/B/E/S. Data as of November 28, 2024.

When it comes to financials, we have become more comfortable with U.S. regional banks given fears of a recession have dissipated, along with concerns about the health of the commercial real estate market. We have gravitated toward well-capitalized banks that are experienced acquirers, those best suited for a gradual reduction in interest rates and those positioned in faster-growing regions of the U.S., such as the Southeast.


In consumer discretionary, we see a range of growth runways. For instance, TopBuild, a provider of installation materials for residential homes and commercial buildings, has benefited from increased energy efficiency requirements and a housing supply deficit in the U.S. On the other end of the spectrum, there’s Mediterranean fast-casual restaurant CAVA Group, which has seen strong growth from consumer demand for healthy, quick and customizable meals that are reasonably priced.  

4.   Growing tailwinds from the reindustrialization of America

A supportive macroeconomic backdrop is only part of the overall story for small-cap stocks. These companies often need a structural growth runway to thrive.


Made in America is one of them. The reindustrialization of the U.S. is an ideal set up for some smaller industrial companies, who make less glamorous products ranging from heating systems to insulation materials to specialized sensors used in state-of-the-art manufacturing plants. Some of these companies have been around for decades and have carved out niche market shares and pricing power, making them cash generative and defensible businesses.


A major overhaul of the aging American power grid should also be a catalyst for smaller industrial firms who make niche tools and parts. Industries that have large energy requirements — semiconductors, pharmaceuticals and autos — are part of the reshoring wave.


Overall, a tidal wave of U.S. government spending on infrastructure, projected at $1.4 trillion through 2030, is poised to reshape American manufacturing, semiconductor and energy industries and be a source of sustained demand.


Importantly for the small cap universe, the reshoring of supply chains is not just a U.S. story. It’s also happening in India, countries in Southeast Asia and Europe.


Establishing new manufacturing hubs in certain regions of the world require vast supply chains to operate, and we believe many smaller companies will get opportunities to participate, including niche European, Asian and Australian suppliers of industrial materials, chemicals and semiconductors. 

5.   The AI spending boom presents opportunities

The AI boom is another tailwind for small caps. The largest U.S. technology companies collectively plan to spend hundreds of billions of dollars over the next three years to get pole position in the AI race. Much of the spending is earmarked for data centers.


Generative AI tools like ChatGPT run on large language models hosted on thousands of servers in massive data centers. These data centers require cooling systems to help the servers run more efficiently, as well as a power infrastructure consisting of transformers, generators and transmission lines. The buildout is creating parallel opportunities to invest outside the mega cap tech names that dominate AI such as Nvidia, Microsoft or Meta.


Smaller companies such as Comfort Systems USA, a maker of heating and ventilation systems, and Modine, which builds fan walls to prevent overheating, are among those benefiting from data center growth for example.


Our technology analysts anticipate new AI business models to emerge from the enormous amount of excess compute capacity that is currently under development. One area may be small firms that provide specialized application software or computer hardware. According to consultancy EY, there are approximately 50 AI companies currently in the IPO registration process and a third are profitable.

6.   The IPO market could become fertile ground again

We are beginning to see signs that the IPO market — once fertile ground for small cap investors — could yield more promising opportunities. The market seems to be normalizing after a long spell of ultra-low interest rates kept many promising startups in the private market. It also inflated valuations for some deals. And in some cases, multiple rounds of venture capital funding drove market valuations so high that when a company went public their market capitalization fell outside the traditional parameters of the small cap category.


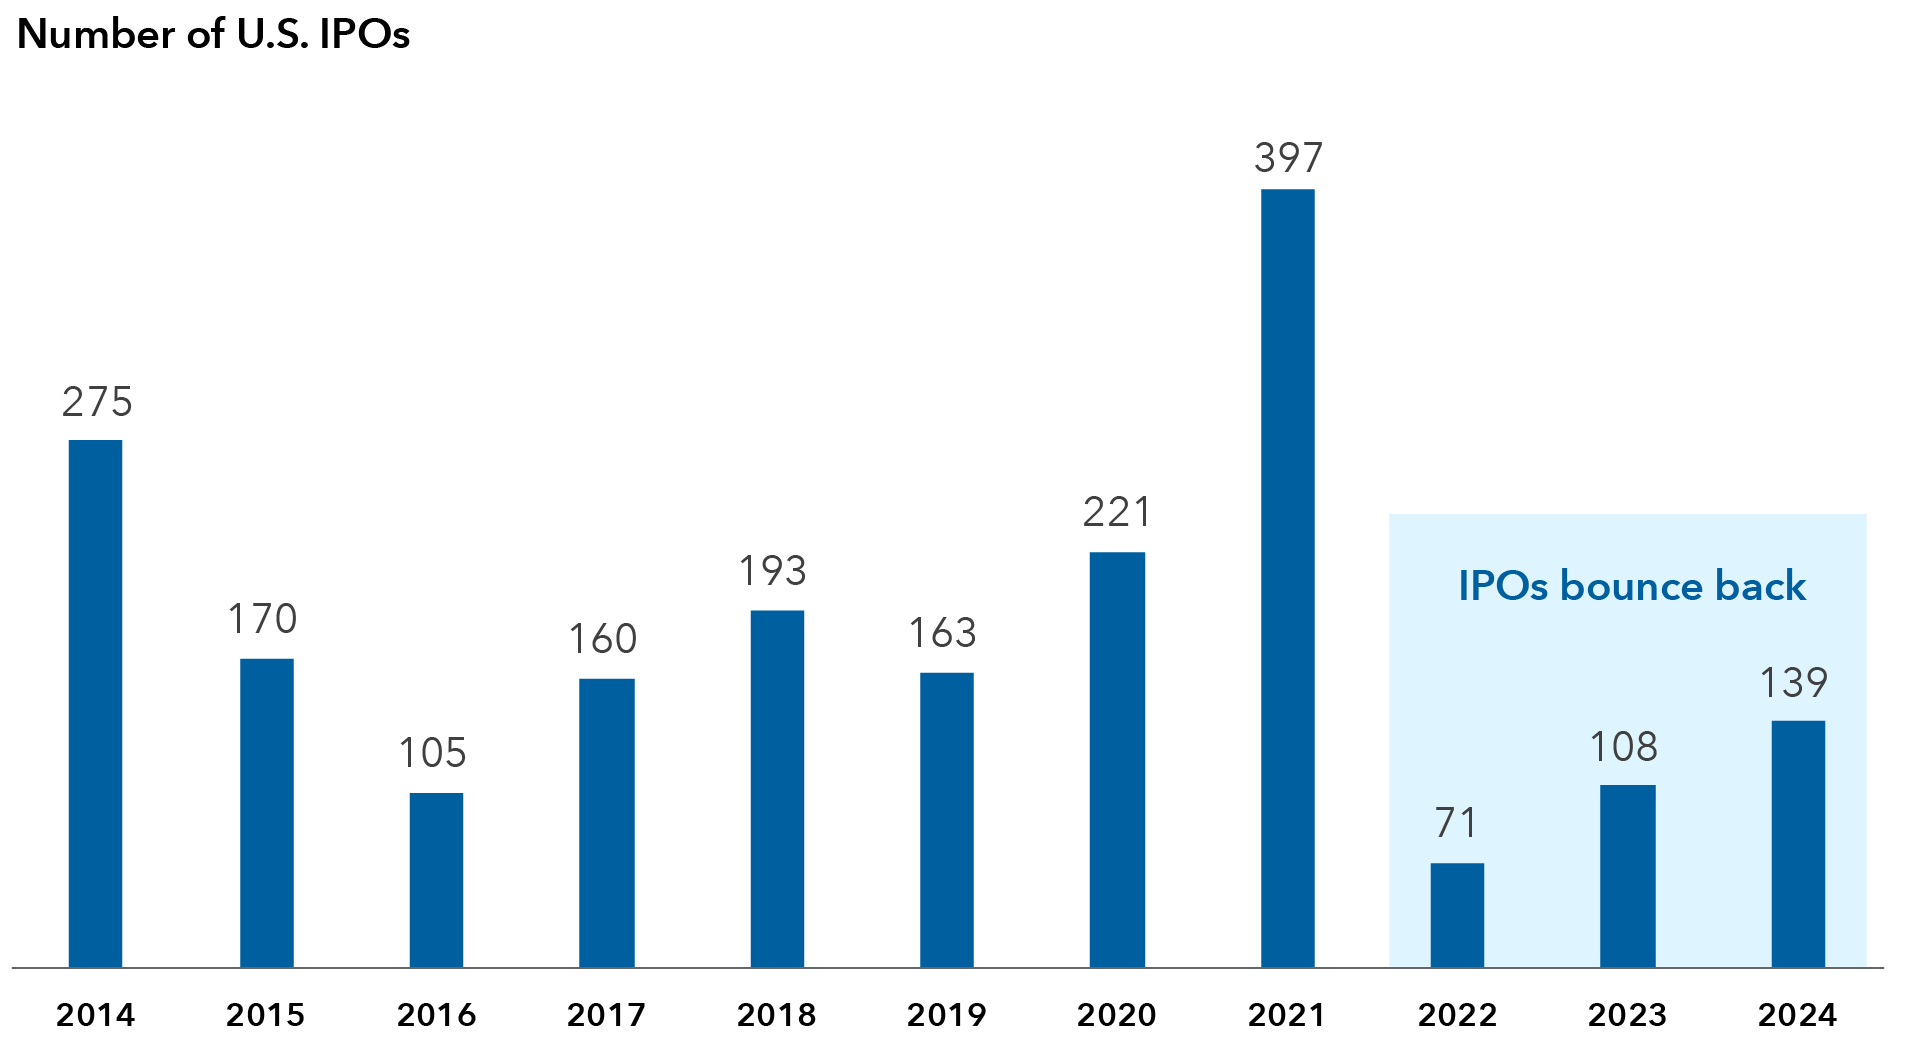
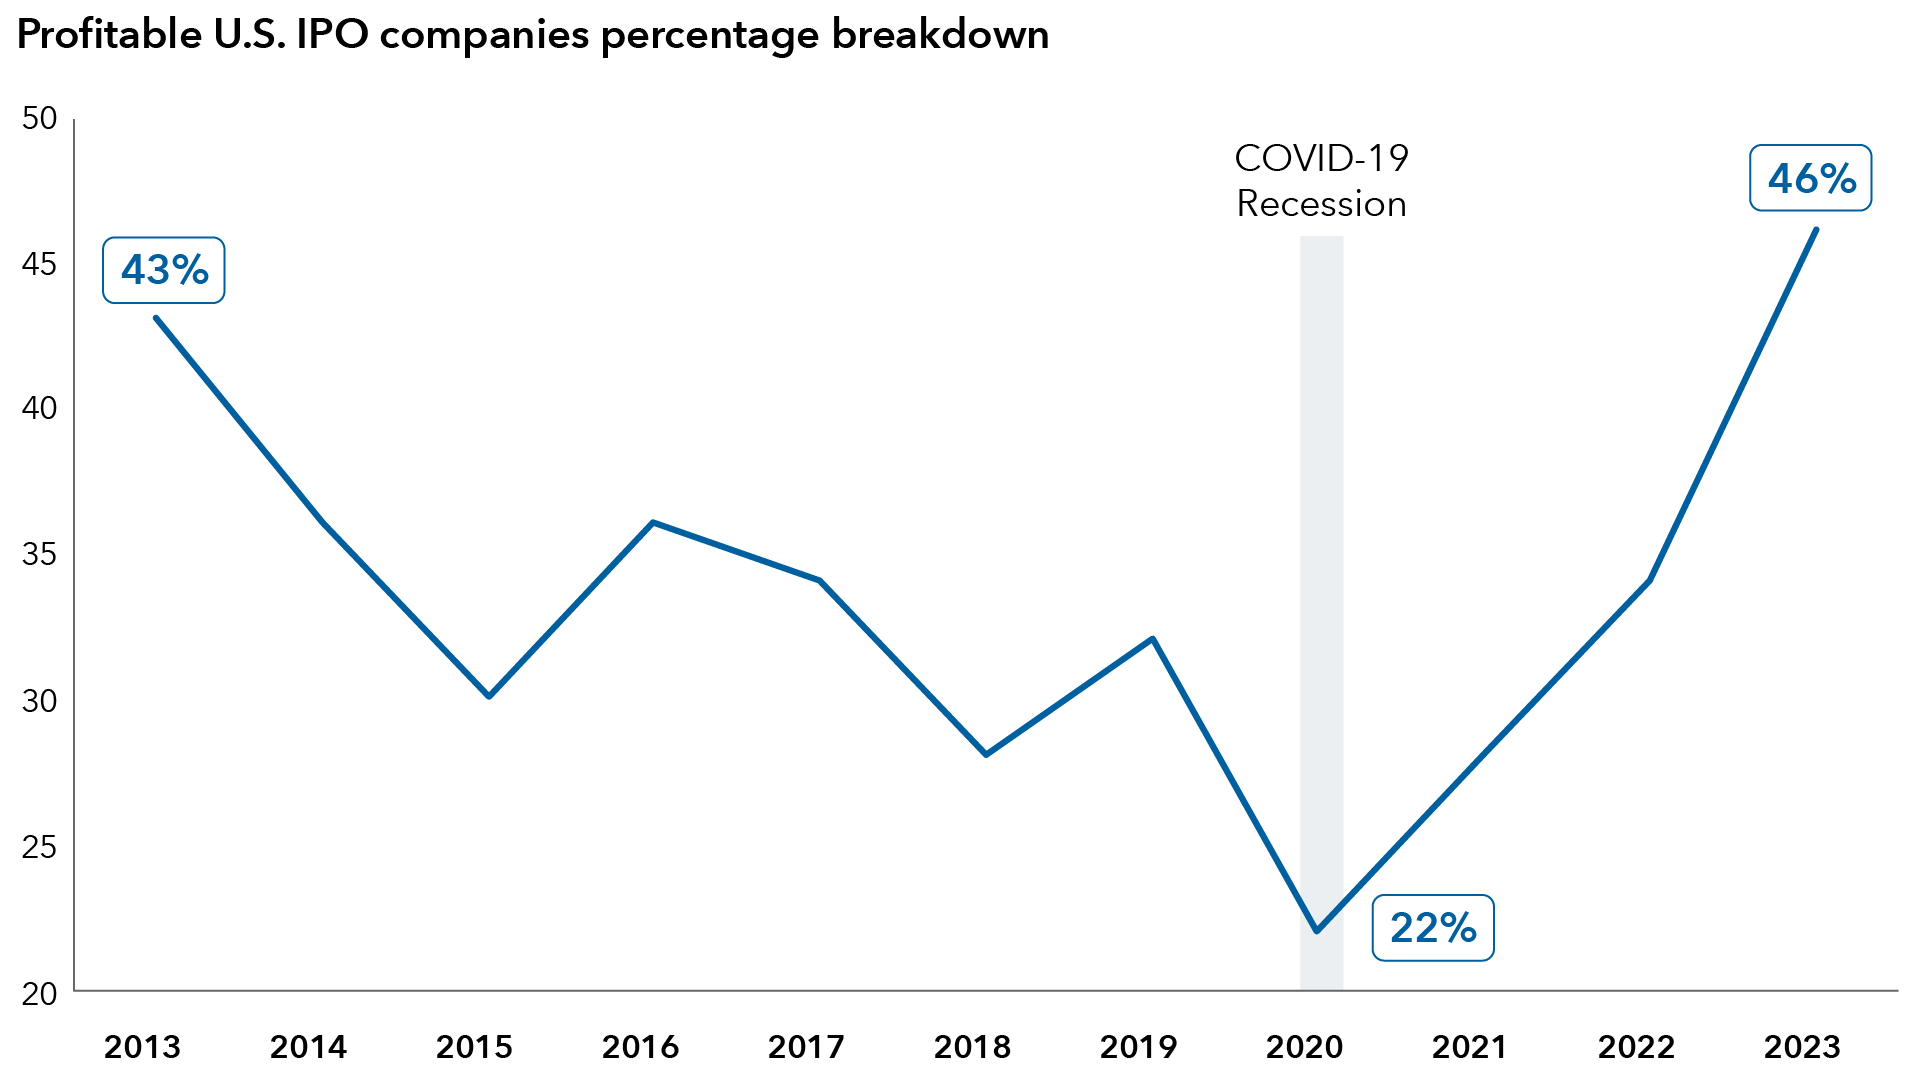
Overall IPO activity has increased. While tech companies usually get the most fanfare, there’s been a number of IPOs for consumer companies and industrial product makers. And in a promising sign, the number of profitable IPO companies in the U.S. is on the rise again. 

IPO activity is perking up after falling off a cliff

The chart illustrates the number of U.S. IPOs from 2014 through 2024. In 2014, there were 275 IPOs, followed by a significant drop to 170 in 2015. The decline continued in 2016 with 105 IPOs. An uptick occurred in 2017 with 160 IPOs, which rose further to 193 in 2018. However, the number of IPOs decreased to 163 in 2019, before climbing to 221 in 2020. A sharp increase was seen in 2021 with 397 IPOs, the highest in the period. The following years witnessed a decline but have been rising since 2022: 71 IPOs in 2022, 108 in 2023, and 139 in 2024, indicating a gradual recovery.

Source: Renaissance Capital. Data reflects IPOs with market capitalizations of $50 million or higher. Datas of December 5, 2024. 

We also anticipate opportunities to invest from the growing backlog of private equity-backed companies in the IPO pipeline. After a slowdown in IPO and M&A activity the past couple of years, there is pent up demand from private equity (PE) investors to monetize their investments through IPOs.


Historically, we have found that when the IPO market starts to rebound, higher quality companies with better-run businesses and prospects are often the first brought to market. These deals are typically sold at more palatable valuations versus times when the IPO market is red-hot and companies with less attractive balance sheets are rushed to market.

There’s been an upswing in profitable IPO companies

The line chart illustrates the percentage of profitable IPO companies from 2013 to 2023. Starting at 43% in 2013, the percentage of profitable IPOs declines to 22% during the COVID-19 pandemic recession in 2020.  However, the chart shows a recovery post-2020, with the percentage of profitable IPOs climbing steadily and peaking at 46% in 2023.

Source: WilmerHale 2024 IPO Report, based on data from SEC filings and IPO Vital Signs.

Bottom line: Be selective

While the U.S. equity market is concentrated in mega caps, we believe now is an ideal time to reconsider opportunities in small caps, which could be poised to benefit from a soft economic landing, pro-growth policies, accelerating earnings growth and cheaper valuations on a relative basis. 


In our view, investing in small cap stocks requires in-depth, on-the-ground research. Small caps are an eclectic group of companies with a wide range of outcomes, depending on the line of business, the quality of management and the direction of interest rates.


We are entering a disruptive period resulting from the development of AI, the reshoring of supply chains and renewed capital investment — factors that likely will increase competition in certain areas and displace some companies. Unlike their larger peers in the S&P 500, smaller companies have less diversified streams of revenue and can be more susceptible to the pace of global growth and interest rate changes.


Therefore, we remain selective and measured in our investments in small-cap stocks, focusing on companies with more durable business models or those that appear positioned to prosper from growth trends over this decade.

JUNA

Julian Abdey is an equity portfolio manager with 28 years of investment industry experience (as of 12/31/2023). He holds an MBA from Stanford and an undergraduate degree in economics from Cambridge University.

aidan-oconnell-color-600x600

Aidan O’Connell is an equity portfolio manager with 29 years of investment industry experience (as of 12/31/2023). He holds an MBA from the Wharton School of the University of Pennsylvania, a master’s degree in international studies from Johns Hopkins University’s School of Advanced International Studies, and a bachelor’s degree in French and English from Dartmouth College. He also holds the Chartered Financial Analyst® designation. 

kent-chan-color-600X600

Kent Chan is an equity investment director with 32 years of investment industry experience (as of 12/31/2023). He holds a bachelor’s degree in political economics from the University of California, Berkeley.

Generally, a small-cap stock refers to companies with a market capitalization between $300 million and $2 billion while large cap stock refers to companies with a market capitalization of more than $10 billion.


The MSCI All Country World Index (ACWI) is a free float-adjusted market capitalization weighted index that is designed to measure equity market results in the global developed and emerging markets, consisting of more than 40 developed and emerging market country indexes.


The MSCI All Country World Small Cap Index captures small cap representation across 23 developed markets and 24 emerging markets countries.


The MSCI All Country World Large Cap Index captures large cap representation across 23 developed markets and 24 emerging markets countries.


London Stock Exchange Group plc and its group undertakings (collectively, the “LSE Group”). © LSE Group 2023. FTSE Russell is a trading name of certain of the LSE Group companies. FTSE® and Russell® indexes are trademarks of the relevant LSE Group companies and are used by any other LSE Group company under license. All rights in the FTSE Russell indexes or data vest in the relevant LSE Group company which owns the index or the data. Neither LSE Group nor its licensors accept any liability for any errors or omissions in the indexes or data and no party may rely on any indexes or data contained in this communication. No further distribution of data from the LSE Group is permitted without the relevant LSE Group company’s express written consent. The LSE Group does not promote, sponsor or endorse the content of this communication.


The Russell 2000® Index measures the performance of the small-cap segment of the US equity universe. The Russell 2000 Index is a subset of the Russell 3000® Index representing approximately 7% of the total market capitalization of that index, as of the most recent reconstitution. It includes approximately 2,000 of the smallest securities based on a combination of their market cap and current index membership.


The S&P 500 Index is a market-capitalization-weighted index based on the results of approximately 500 widely held common stocks.

Investments are not FDIC-insured, nor are they deposits of or guaranteed by a bank or any other entity, so they may lose value.
Investors should carefully consider investment objectives, risks, charges and expenses. This and other important information is contained in the fund prospectuses and summary prospectuses, which can be obtained from a financial professional and should be read carefully before investing.
Investing outside the United States involves risks, such as currency fluctuations, periods of illiquidity and price volatility. These risks may be heightened in connection with investments in developing countries.
Small-company stocks entail additional risks, and they can fluctuate in price more than larger company stocks.
There have been periods when the results lagged the index(es) and/or average(s). The indexes are unmanaged and, therefore, have no expenses. Investors cannot invest directly in an index.
MSCI has not approved, reviewed or produced this report, makes no express or implied warranties or representations and is not liable whatsoever for any data in the report. You may not redistribute the MSCI data or use it as a basis for other indices or investment products.
Each S&P Index ("Index") shown is a product of S&P Dow Jones Indices LLC and/or its affiliates and has been licensed for use by Capital Group. Copyright © 2024 S&P Dow Jones Indices LLC, a division of S&P Global, and/or its affiliates. All rights reserved. Redistribution or reproduction in whole or in part is prohibited without written permission of S&P Dow Jones Indices LLC.
Statements attributed to an individual represent the opinions of that individual as of the date published and do not necessarily reflect the opinions of Capital Group or its affiliates. This information is intended to highlight issues and should not be considered advice, an endorsement or a recommendation.
All Capital Group trademarks mentioned are owned by The Capital Group Companies, Inc., an affiliated company or fund. All other company and product names mentioned are the property of their respective companies.
Use of this website is intended for U.S. residents only. Use of this website and materials is also subject to approval by your home office.
Capital Client Group, Inc.
This content, developed by Capital Group, home of American Funds, should not be used as a primary basis for investment decisions and is not intended to serve as impartial investment or fiduciary advice.