A rare income opportunity for short-term municipal bonds
KEY TAKEAWAYS
  • Investors have a historic opportunity in strong-yielding, short-term investments.
  • Short-term municipal bonds (munis) can benefit from price appreciation when interest rates fall.
  • These bonds may also offer income exempt from federal, and sometimes state and local, taxes.

Just a few years ago, investors seeking strong levels of income had a very limited range of opportunities. Today, the opposite is true – income potential abounds. In the current economy, short-term yields are higher than long-term yields, in some cases. Investors have the opportunity to earn ample income with relatively high-quality investments. And tax-aware investors may benefit significantly with income exempt from federal, and sometimes state and local taxes, available with municipal (muni) bond investments. We believe one such area with a strong income opportunity to consider is short-term munis.


A unique historical period


Investors have been experiencing an unusual time in history: short-term muni yields remain elevated when compared to the past decade. Because of the strong yield delivered by shorter-term investments, investors can pursue a historically high level of income even without introducing as much interest rate risk into a portfolio as they would have had to in the past. From a yield perspective, investors are not being “paid” to take additional duration risk as they have in the past. (Duration indicates a bond fund’s sensitivity to interest rates; generally, lower duration indicates less sensitivity.) Today’s spreads (i.e., the difference between yields) are extremely tight compared to historical levels. 
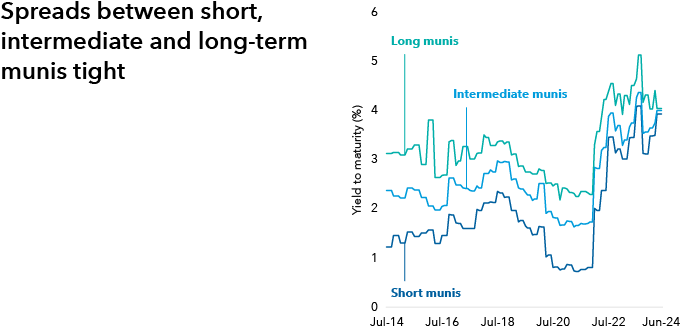

Illustration titled Spreads between short, intermediate and long term munis tight. Illustration of yield to maturity (%) of multiple Morningstar categories. Short munis start July 2014 at 1.23 and end June 2024 at 3.94. Intermediate munis start July 2024 at 2.38 and end June 2024 at 4.00. Long munis start July 2014 at 3.13 and end June 2024 at 4.05.

Source: Morningstar. Data as of 6/30/24. Categories are Morningstar categories. Short munis represented by Muni National Short. Intermediate munis represented by Muni National Interm. Long munis represented by Muni National Long.

A tale of two inversions


Let’s take a brief look at why short-term yielding investments are currently enticing. Both the Treasury and muni yield curves are inverted (meaning short-term interest rates are higher than long-term rates). This is particularly unusual for the muni yield curve, but both have now been inverted for the longest time in history. 
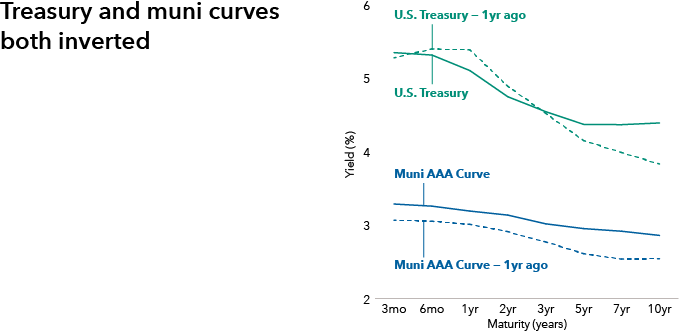

Illustration titled Treasury and muni curves both inverted. Illustration of municipal and Treasury yield curves over time periods, at 3 and 6 months, and 1, 2, 3, 5, 7 and 10 years. For data as of 6/30/24, the Muni AAA curve starts at 3.29 at 3 months and gently curves down ending at 2.86 at 10 years. The US Treasury curve starts at 5.35 at 3 months, and curves down ending at 4.40 at 10 years. For data one year ago, the Muni AAA Curve starts at 3.07 at 3 months and gently curves down ending at 2.55 at 10 years. For data one year ago, the US Treasury curve starts at 5.28 at 3 months and sharply trends down, ending at 3.84 at 10 years.

Source: Bloomberg. Data as of 6/30/24. Chart adjusted to reflect the tax-equivalent yield at the highest tax rate (37% plus 3.8% Medicare tax). U.S. Treasury represented by Bloomberg U.S. Treasury Index. Muni AAA Curve represented by BVAL (Bloomberg Valuation Service) Municipal AAA Yield Curve (Callable).

Does the Fed play a role?


At this point most investors are expecting rate cuts, not more rate hikes. U.S. monetary policymakers appear to be signaling a first cut in September. When this happens, there is no guarantee longer term yields will decrease initially, but the shorter term rates should be more directly impacted and begin to fall. That means shorter-term bonds would experience a positive impact with price appreciation. 


Illustration titled How might declining yields impact bond prices based on varied duration? A table illustrating varying yields and durations of bonds. Decline in yields (%) (horizontal axis) states 0.25, 0.50, 0.75, and 1.0. Duration (years) (vertical axis) states 2, 4 and 6. For a duration of 2, for each decline in yield number, the data shows 0.5, 1.0, 1.5 and 2.0, respectively. For a duration of 4, for each decline in yield number, the data shows 1.0, 2.0, 3.0 and 4.0, respectively. For a duration of 6, for each decline in yield number, the data shows 1.5, 3.0, 4.5 and 6.0, respectively.

Source: Capital Group. Duration measures a bond’s sensitivity to changes in interest rates. Figures show percentage increase of a bond’s price based on decline in yields. As an example, for a bond with a duration of 2 years, a 0.25% decline in interest rates would increase the bond’s price by 0.5%.

The potential upside for investors? They could benefit both from higher starting yield and price appreciation. Yields have already begun to drift lower, so investors holding excess cash could, depending on their investment objectives, consider moving into bonds to capture as much of that potential price appreciation as possible before the Fed moves.


As the Fed cuts rates, bonds may prove a balancing force again.

A primer for moving into short-term munis


Additionally, while cash-like investments (such as certificates of deposits [CDs]) may seem attractive, they deliver a tax hit. Muni bonds, on the other hand, deliver income exempt from federal taxes, and sometimes state and local taxes. Taxable investments would need to deliver higher yields to match the yield of a short-term tax-exempt muni investment. Typically referred to as tax-equivalent yield, this is the income a muni would provide if compared to a taxable bond yield with a given tax rate. Here’s an example of what a potential short-term muni could offer versus a CD, based on tax rates.


Illustration titled Muni income could surpass CDs, with a subtitle of Core muni (Bloomberg Municipal Short 1-5 Year Index) tax-equivalent yield to worst (%) vs. a CD earning 5%. Illustration of Bloomberg Municipal Short 1-5 Year Index tax-equivalent yield to worst (%) across different tax brackets, starting at 0% and ending at 40.8%. A line at 5% yield represents CDs. The 0% is 3.39% and then the yield gently rises across tax brackets until ending at 5.73% for 40.8%.

Sources: Capital Group, Bloomberg Index Services Ltd. Data as of 6/30/24. The 40.8% assumes the 3.8% Medicare tax and the top federal marginal tax rate for 2024 of 37%.

Exposure to short-term munis is available with mutual funds and exchange traded funds (ETFs). Mutual fund investors may want to consider the Limited Term Tax-Exempt Bond Fund of America® or American Funds Short-Term Tax-Exempt Bond Fund®. Their tax-equivalent yields could deliver a higher yield to investors than the yields illustrated in the below table. While not as low-risk as CDs, these funds aim for a higher credit quality than many stock or other bond investments. Some investors may want to own ETFs, which offer tax efficiency and other potential benefits. CGSM — Capital Group Short Duration Municipal Income ETF — is a fund that may serve as a nice step-out from cash while providing broad exposure across sectors and issuers. CGSM seeks a relatively high credit quality, low duration investment profile. There are differences between mutual funds and ETFs, including costs and expenses, liquidity, transparency of holdings and tax features.


Fund/ETF Effective duration* Yield to worst (%) Percentage investment grade (BBB/Baa and above)
Limited Term Tax-Exempt Bond Fund of America 3.5 3.6 91.6
American Funds Short-Term Tax-Exempt Bond Fund 2.3 3.4 89.3
CGSM — Capital Group Short Duration Municipal Income ETF 2.4 4.0 76.9

The clock may be ticking


Investing after rate cuts could lead to missing out on capturing a higher yield and the price appreciation when those rates drop (prices and yields move inversely from each other). Investors can discuss with their financial advisors to determine the most appropriate vehicle, a mutual fund or ETF. Now may be the time to consider this opportunity.


* Effective duration is a duration calculation for bonds that takes into account that expected cash flows will fluctuate as interest rates change.


Past results are not predictive of results in future periods.

Investments are not FDIC-insured, nor are they deposits of or guaranteed by a bank or any other entity, so they may lose value.
Investors should carefully consider investment objectives, risks, charges and expenses. This and other important information is contained in the fund prospectuses and summary prospectuses, which can be obtained from a financial professional and should be read carefully before investing.
Capital Group exchange-traded funds (ETFs) are actively managed and do not seek to replicate a specific index. ETF shares are bought and sold through an exchange at the then current market price, not net asset value (NAV), and are not individually redeemed from the fund. Shares may trade at a premium or discount to their NAV when traded on an exchange. Brokerage commissions will reduce returns. There can be no guarantee that an active market for ETFs will develop or be maintained, or that the ETF's listing will continue or remain unchanged.
Bond ratings, which typically range from AAA/Aaa (highest) to D (lowest), are assigned by credit rating agencies such as Standard & Poor's, Moody's and/or Fitch, as an indication of an issuer's creditworthiness.
Lower rated bonds are subject to greater fluctuations in value and risk of loss of income and principal than higher rated bonds.
The return of principal for bond portfolios and for portfolios with significant underlying bond holdings is not guaranteed. Investments are subject to the same interest rate, inflation and credit risks associated with the underlying bond holdings.
Income from municipal bonds may be subject to state or local income taxes and/or the federal alternative minimum tax. Certain other income, as well as capital gain distributions, may be taxable. 
Nondiversified funds have the ability to invest a larger percentage of assets in the securities of a smaller number of issuers than a diversified fund. As a result, poor results by a single issuer could adversely affect fund results more than if the fund invested in a larger number of issuers. See the applicable prospectus for details.
There have been periods when the results lagged the index(es) and/or average(s). The indexes are unmanaged and, therefore, have no expenses. Investors cannot invest directly in an index.
Source: Bloomberg Index Services Limited. BLOOMBERG® is a trademark and service mark of Bloomberg Finance L.P. and its affiliates (collectively "Bloomberg"). Bloomberg or Bloomberg's licensors own all proprietary rights in the Bloomberg Indices. Neither Bloomberg nor Bloomberg's licensors approves or endorses this material, or guarantees the accuracy or completeness of any information herein, or makes any warranty, express or implied, as to the results to be obtained therefrom and, to the maximum extent allowed by law, neither shall have any liability or responsibility for injury or damages arising in connection therewith.
Statements attributed to an individual represent the opinions of that individual as of the date published and do not necessarily reflect the opinions of Capital Group or its affiliates. This information is intended to highlight issues and should not be considered advice, an endorsement or a recommendation.
All Capital Group trademarks mentioned are owned by The Capital Group Companies, Inc., an affiliated company or fund. All other company and product names mentioned are the property of their respective companies.
Use of this website is intended for U.S. residents only.
Capital Client Group, Inc.
This content, developed by Capital Group, home of American Funds, should not be used as a primary basis for investment decisions and is not intended to serve as impartial investment or fiduciary advice.
© 2024 Morningstar, Inc. All Rights Reserved. Some of the information contained herein: (1) is proprietary to Morningstar and/or its content providers; (2) may not be copied or distributed; and (3) is not warranted to be accurate, complete or timely. Neither Morningstar, its content providers nor Capital Group are responsible for any damages or losses arising from any use of this information. Past performance is no guarantee of future results. Information is calculated by Morningstar. Due to differing calculation methods, the figures shown here may differ from those calculated by Capital Group.

Unlike mutual fund and ETF shares, investments in U.S. Treasuries are guaranteed by the U.S. government as to the payment of principal and interest. In addition, certificates of deposit (CDs) are FDIC-insured and, if held to maturity, offer a guaranteed return of principal.

Yield to worst is the lowest yield that can be realized by either calling or putting on one of the available call/put dates, or holding a bond to maturity.

The Bloomberg Municipal Short (1-5) Index is a component of the Bloomberg Municipal Bond index.

The BVAL (Bloomberg Valuation Service) Municipal AAA Yield Curve (Callable) is populated with high quality U.S. municipal bonds with an average rating of AAA from Moody’s and S&P. The curve is a standard market scale with non-call yields up to year 10 and callable yields thereafter.

The Bloomberg U.S. Treasury Index measures US dollar-denominated, fixed-rate, nominal debt issued by the U.S. Treasury.

Morningstar categories: Muni national long portfolios invest in bonds issued by various state and local governments to fund public projects. The income from these bonds is generally free from federal taxes. To lower risk, these portfolios spread their assets across many states and sectors. These portfolios have durations of more than seven years (or, if duration is unavailable, average maturities of more than 12 years). Muni national intermediate portfolios invest in bonds issued by various state and local governments to fund public projects. The income from these bonds is generally free from federal taxes. To lower risk, these portfolios spread their assets across many states and sectors. These portfolios have durations of 4.5 to seven years (or, if duration is unavailable, average maturities of five to 12 years). Muni national short portfolios invest in bonds issued by various state and local governments to fund public projects. The income from these bonds is generally free from federal taxes. To lower risk, these portfolios spread their assets across many states and sectors. These portfolios have durations of less than 4.5 years (or, if duration is unavailable, average maturities of less than five years).