- While equities were battered in the recent round of volatility, bonds gained and appeared to resume their traditional role of providing ballast.
- With inflation coming under control and a potential shift in the rate cycle, bonds are now in a position to offer cushion against equity market volatility.
- It may be a good time for investors to reevaluate their portfolio’s bond exposure both in terms of overall allocation and within fixed income sectors.
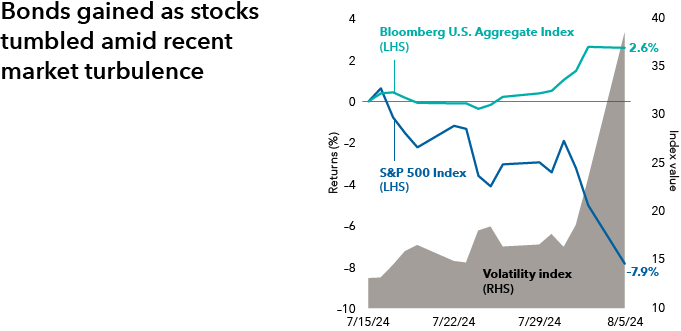
The U.S. stock market neared correction territory in early August 2024 as a red-hot streak for equities appeared to finally cool. The S&P 500 Index tumbled 6.1% over a three-day period, including its largest one-day drop in nearly two years, and pushed losses to 7.9% since mid-July. The selloff was preceded by a variety of factors ranging from Japanese central bank actions that stoked investor anxiety to weakness in labor markets that heightened fears of a potential recession. Volatility, as measured by the Cboe Volatility Index (VIX), reached its highest level since 2020 as investors shed exposure to riskier assets.
Amid the headlines of the volatile period, there is one factor that we believe will be very important for investors to note: while equities were battered, bonds gained.
The Bloomberg U.S. Aggregate Index, a benchmark for the U.S. investment-grade taxable bond market, returned 1.53% during the three-day period when stocks tumbled, helping to push the index’s returns to 2.6% since mid-July. While this period was admittedly short-lived, the gains contrasted with what investors experienced in 2022. At that time, the Federal Reserve’s rate-hiking campaign starting from historic low levels inflicted steep losses on fixed income, which also sent equity markets reeling. Bonds fell in tandem with stocks and left some investors questioning the value of a traditional 60/40 portfolio (shorthand for a diversified portfolio built with 60% equities and 40% fixed income).

Source: Bloomberg. Data as of 8/5/24. Volatility index is represented by the Cboe Volatility Index (VIX), which is designed to produce a measure of constant, 30-day expected volatility of the U.S. stock market, based on S&P 500 Index call and put options. A higher VIX index level indicates higher volatility.
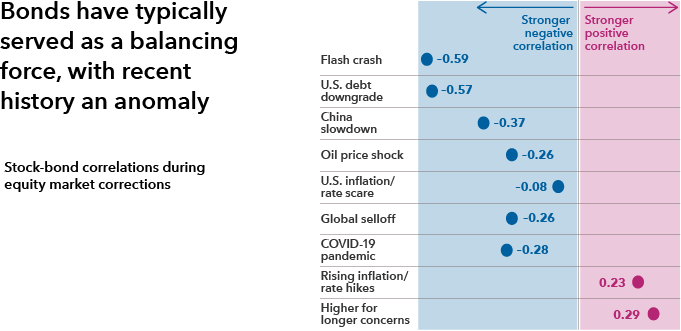
But as stocks faced down this latest selloff, high-quality bonds appeared to resume their traditional role of providing ballast. Higher inflation and aggressive Fed rate hikes are what drove bond yields higher – with the 10-year Treasury yield peaking near 5% in October 2023 - providing ample room for yields to fall and for bond prices to appreciate. Inflation coming under control and the end of Fed rate hikes provided the backdrop for the traditional, negative correlation between stocks and bonds to be restored.
While this result might feel very different from what happened in 2022, seasoned investors may feel some relief seeing a return of the traditional relationship between stocks and bonds. With the potential shift in the rate cycle, bonds are now in a position to offer cushion against equity market volatility. The Fed has ammunition to fight recession in the form of cutting its target policy rate. And it has ample room to cut: The fed funds rate, which sits at 5.25% to 5.5%, is at a much higher level than investors have become accustomed to over the past 15 years. Fed chair Jerome Powell has signaled that rate cuts could come as soon as September.

Source: Morningstar. As of 2/21/24. Correlation is a statistic that measures the degree to which two variables move in relation to each other; a positive correlation implies that they move together in the same direction while a negative correlation implies that they move in opposite directions. Correlation figures based on returns data for the S&P 500 Index versus the Bloomberg U.S. Aggregate Index. Correlation shown for the nine equity market correction periods since 2010. Corrections are based on price declines of 10% or more (without dividends reinvested) in the unmanaged S&P 500 with at least 75% recovery. Dates for correction periods are as follows: Flash crash, 4/24/10 to 7/2/10. U.S. debt downgrade: 5/2/11 to 10/3/11. China slowdown: 5/22/15 to 8/25/15. Oil price shock: 11/4/15 to 2/11/16. U.S. inflation/rate scare: 1/27/18 to 2/8/18. Global selloff: 9/21/18 to 12/24/18. COVID-19 pandemic: 2/20/20 to 3/23/20. Historic inflation and rate hikes: 1/4/22 to 10/12/22. Higher for longer concerns: 8/1/23 to 10/27/23.
Now may be a good time for investors to reevaluate their portfolio’s bond exposure both in terms of overall allocation and within fixed income sectors. During equity correction periods excluding recent losses driven by rising bond yields, high-quality fixed income with intermediate duration, a measure of interest rate exposure, has provided diversification from equities. This is evidenced by the low or negative correlation of the Bloomberg U.S. Aggregate Index to equities during these periods. In contrast to bonds, cash-like investments face reinvestment risk (meaning the potential inability to find a comparable rate of return elsewhere) rather than offering capital appreciation potential when rates fall.
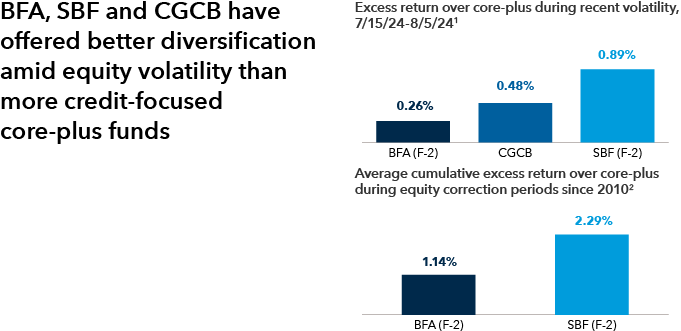
Investors looking for a bond allocation that seeks to serve as a shock absorber for equity volatility should consider pursuing a true core bond fund or a high-quality core plus fund. The Bond Fund of America® (BFA) and American Funds Strategic Bond Fund (SBF) have provided strong diversification from equities. When looking at the recent period of volatility, from mid-July to early August, BFA and SBF have posted returns that outstripped average returns on the Morningstar Intermediate Core-Plus Bond category (core-plus category) by 26 and 89 basis points (bps), respectively. The category is comprised of some core plus strategies which may try to boost income or returns by taking on additional credit risk. Meanwhile CGCB - Capital Group Core Bond ETF, an active ETF launched in 2023, posted excess returns relative to the core-plus category of 48 bps during that timeframe. When looking at equity correction periods since 2010, BFA and SBF also had strong average excess returns over the core-plus category.

Sources: Capital Group, Morningstar. Data as of 8/6/2024.
1Excess returns calculated relative to the Morningstar Intermediate Core-Plus Bond category, which returned 2.06% during the period. The S&P 500 index lost 7.6% over the period.
2Averages were calculated by using the cumulative returns of funds versus the Morningstar Intermediate Core-Plus Bond category during the nine equity market correction periods since 2010, except for SBF - the calculation for which only includes five periods after its March 2016 inception. CGCB is excluded from the chart as it hasn’t experienced a full correction period since its September 2023 inception. Corrections are based on price declines of 10% or more (without dividends reinvested) in the unmanaged S&P 500 with at least 75% recovery. The cumulative returns are based on total returns. Ranges of returns for the equity corrections measured: The Bond Fund of America: -14.07% to 3.41%; American Funds Strategic Bond Fund: -14.46% to 3.04%; Morningstar Intermediate Core-Plus Bond category: -14.73% to 2.25%; S&P 500 Index: -33.79% to -9.94%. There have been periods when the funds have lagged the categories and the index, such as in rising equity markets.
Fixed income has historically served the role of helping to protect portfolios against equity market turmoil. Following the Fed’s historic rate hiking campaign, bonds once again appear poised to offer diversification and balance. Higher starting yields and the prospect of rate cuts means bonds are acting like bonds again, providing a measure of stability during uncertain times.

