- New World Fund’s approach has resulted in historically reduced volatility compared with peers and the MSCI Emerging Markets Index (as measured in this piece by both up and down capture ratios).
- New World Fund can serve as a constant core in an emerging markets portfolio around which more tactical convictions can be added to the portfolio.
- In addition to the mutual fund vehicle, investors can access a similar investment approach through CGNG – Capital Group New Geography Equity ETF.
New World Fund results based on F-2 share class
Managing an emerging markets equity sleeve of a portfolio can come with challenges, but many allocators view it as an important asset class exposure and diversifier in a portfolio. On a monthly rolling 10-year basis, emerging markets have lagged developed markets for roughly the past 15 years, but they outpaced for much of the time from 2000 to 2010, which serves as a reminder of how difficult it is to time markets.1
In the face of these challenges, New World Fund may provide ballast in an emerging markets allocation. The flexible, global approach to growth driven by emerging markets allows portfolio managers to invest in companies domiciled in emerging markets countries as well as multinational companies with revenue coming from emerging markets.
While this isn’t a “pure” approach to emerging markets, it has historically allowed investors to benefit from emerging markets growth while providing resiliency in the form of less down capture versus its Morningstar Diversified Emerging Markets Category peer average (while most funds in the category have little to no fixed income, New World Fund’s portfolio managers have the flexibility to invest a portion of the fund’s assets in fixed income — it was 3.4% of the portfolio as of 6/30/24 — and that may also help to dampen volatility relative to equity indexes). Asset allocators can consider New World Fund as a core emerging markets exposure around which they can attach tactical exposures.
For example, if an asset allocator were to become bullish on the prospects of Indian equities, they can add a country-specific fund that holds Indian equities to their emerging markets allocation alongside New World Fund. When that asset allocator later determines that they are not as bullish on Indian equities as they once were, they can scale back or remove the country-specific fund from their allocation. As specific and tactical ideas come and go, New World Fund can remain in the allocation as a constant.
Here are some specific examples of outcomes with New World Fund as a core fund in an emerging markets sleeve.
Improving down capture with New World Fund
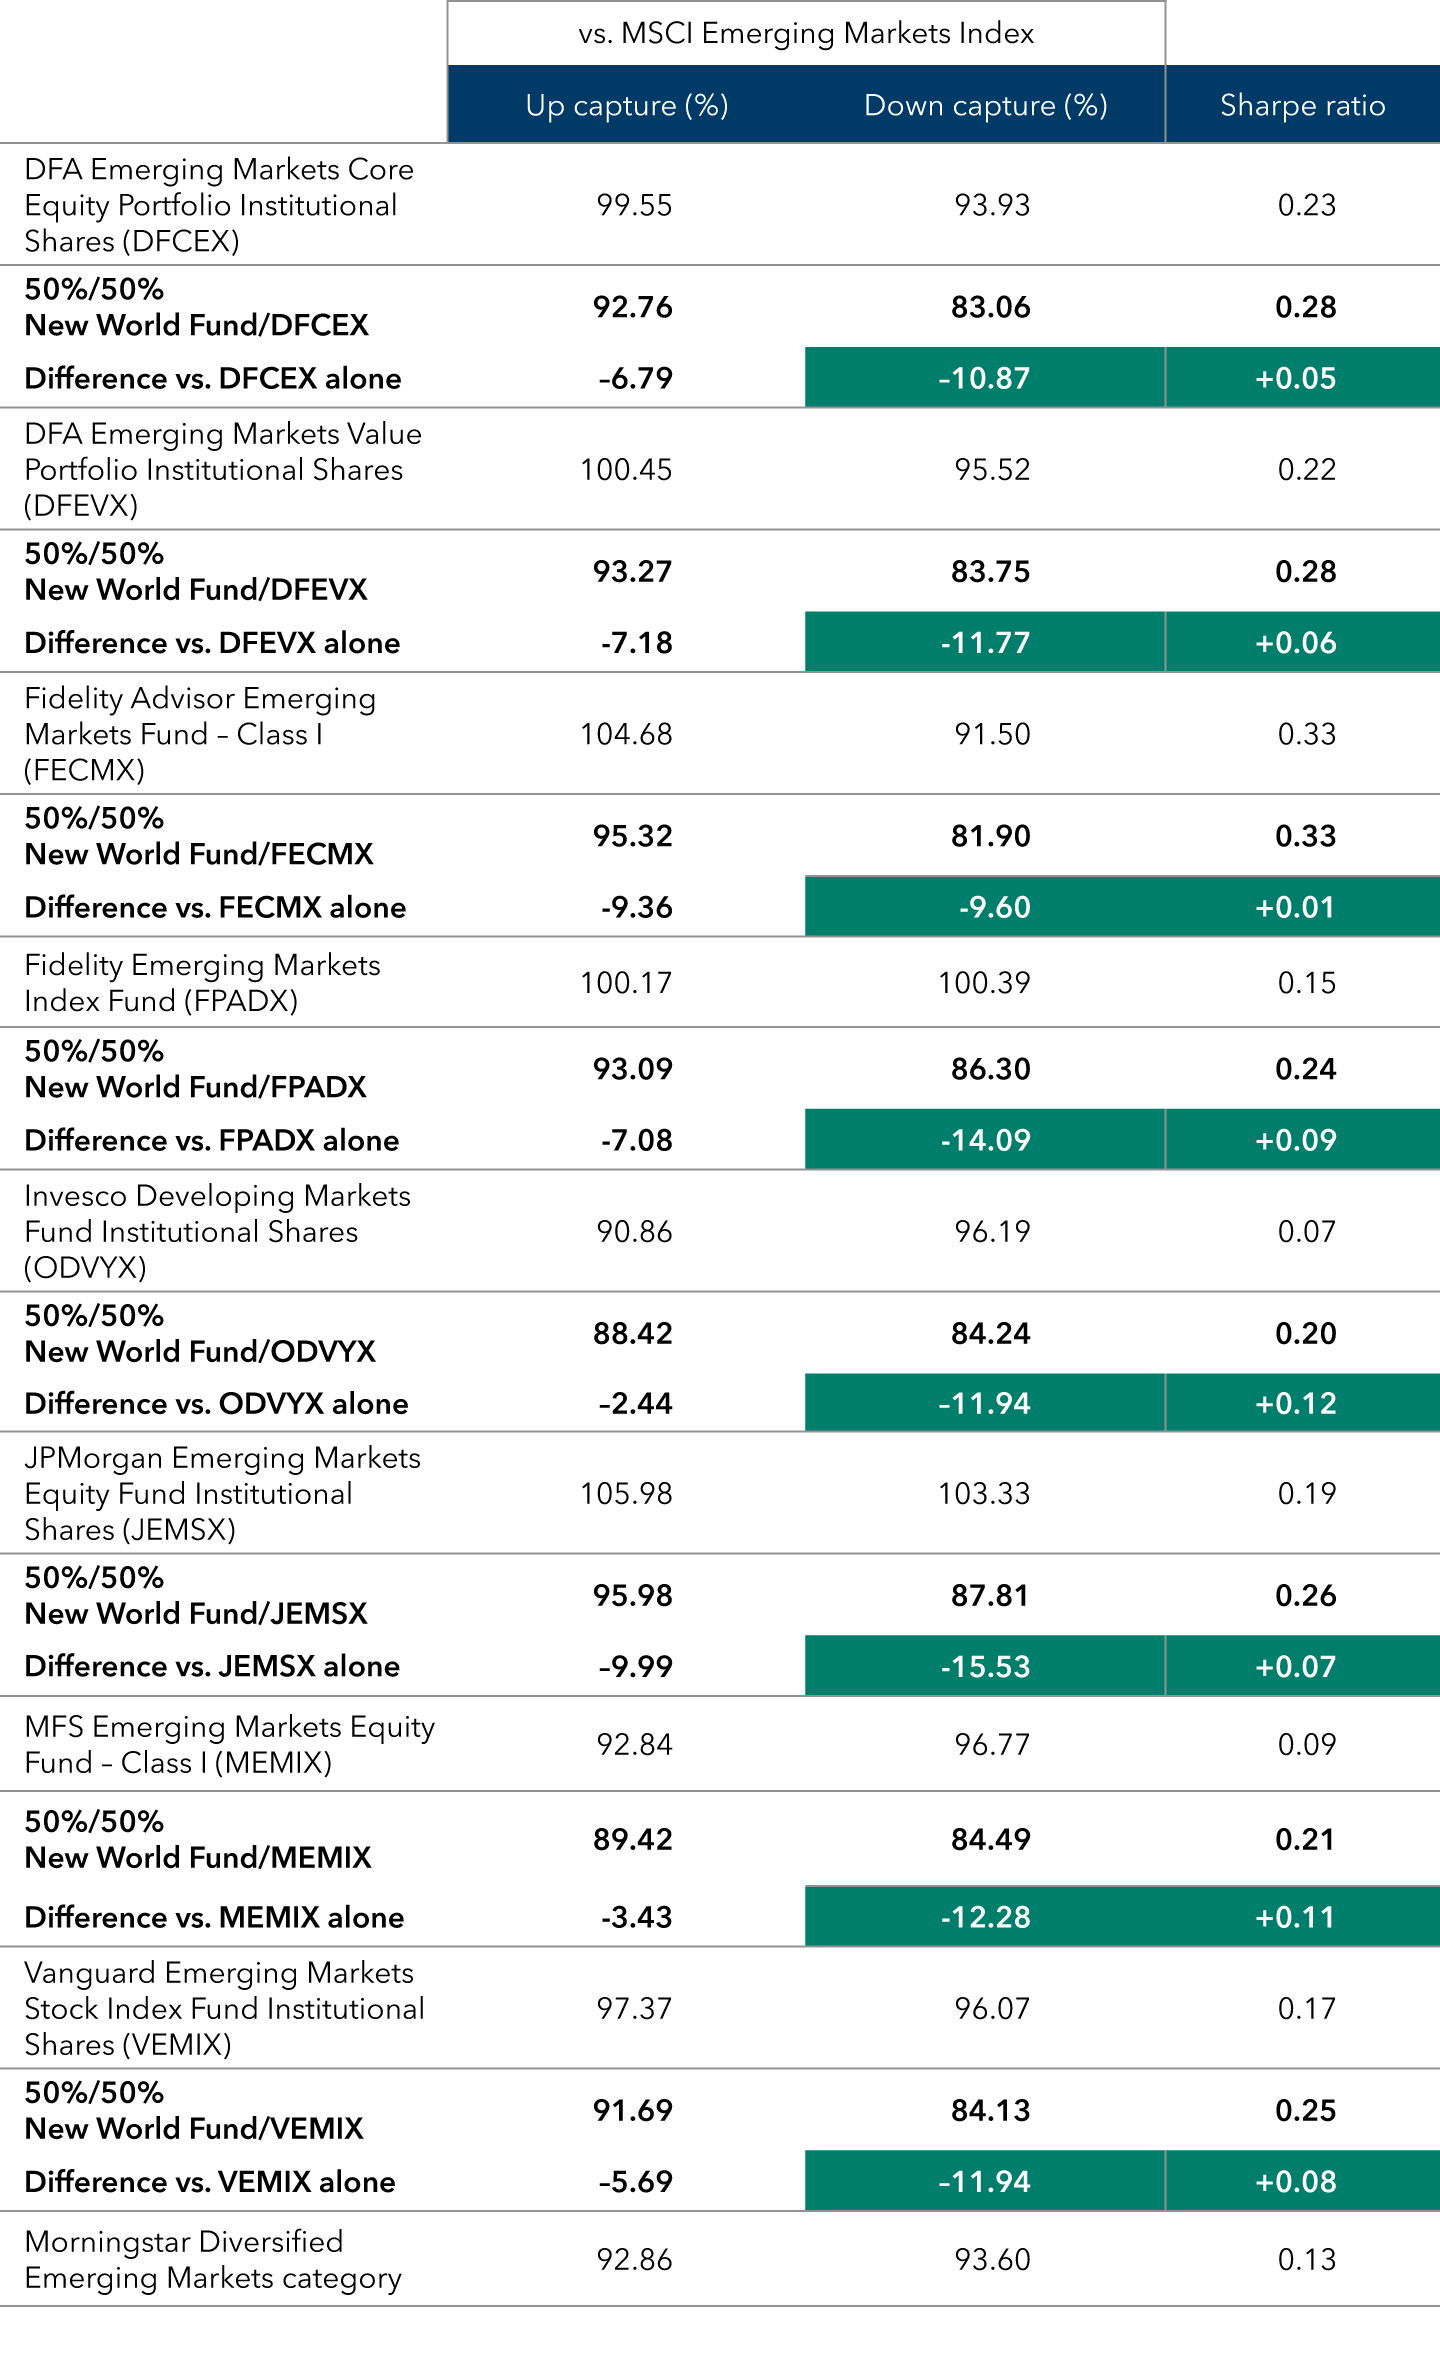
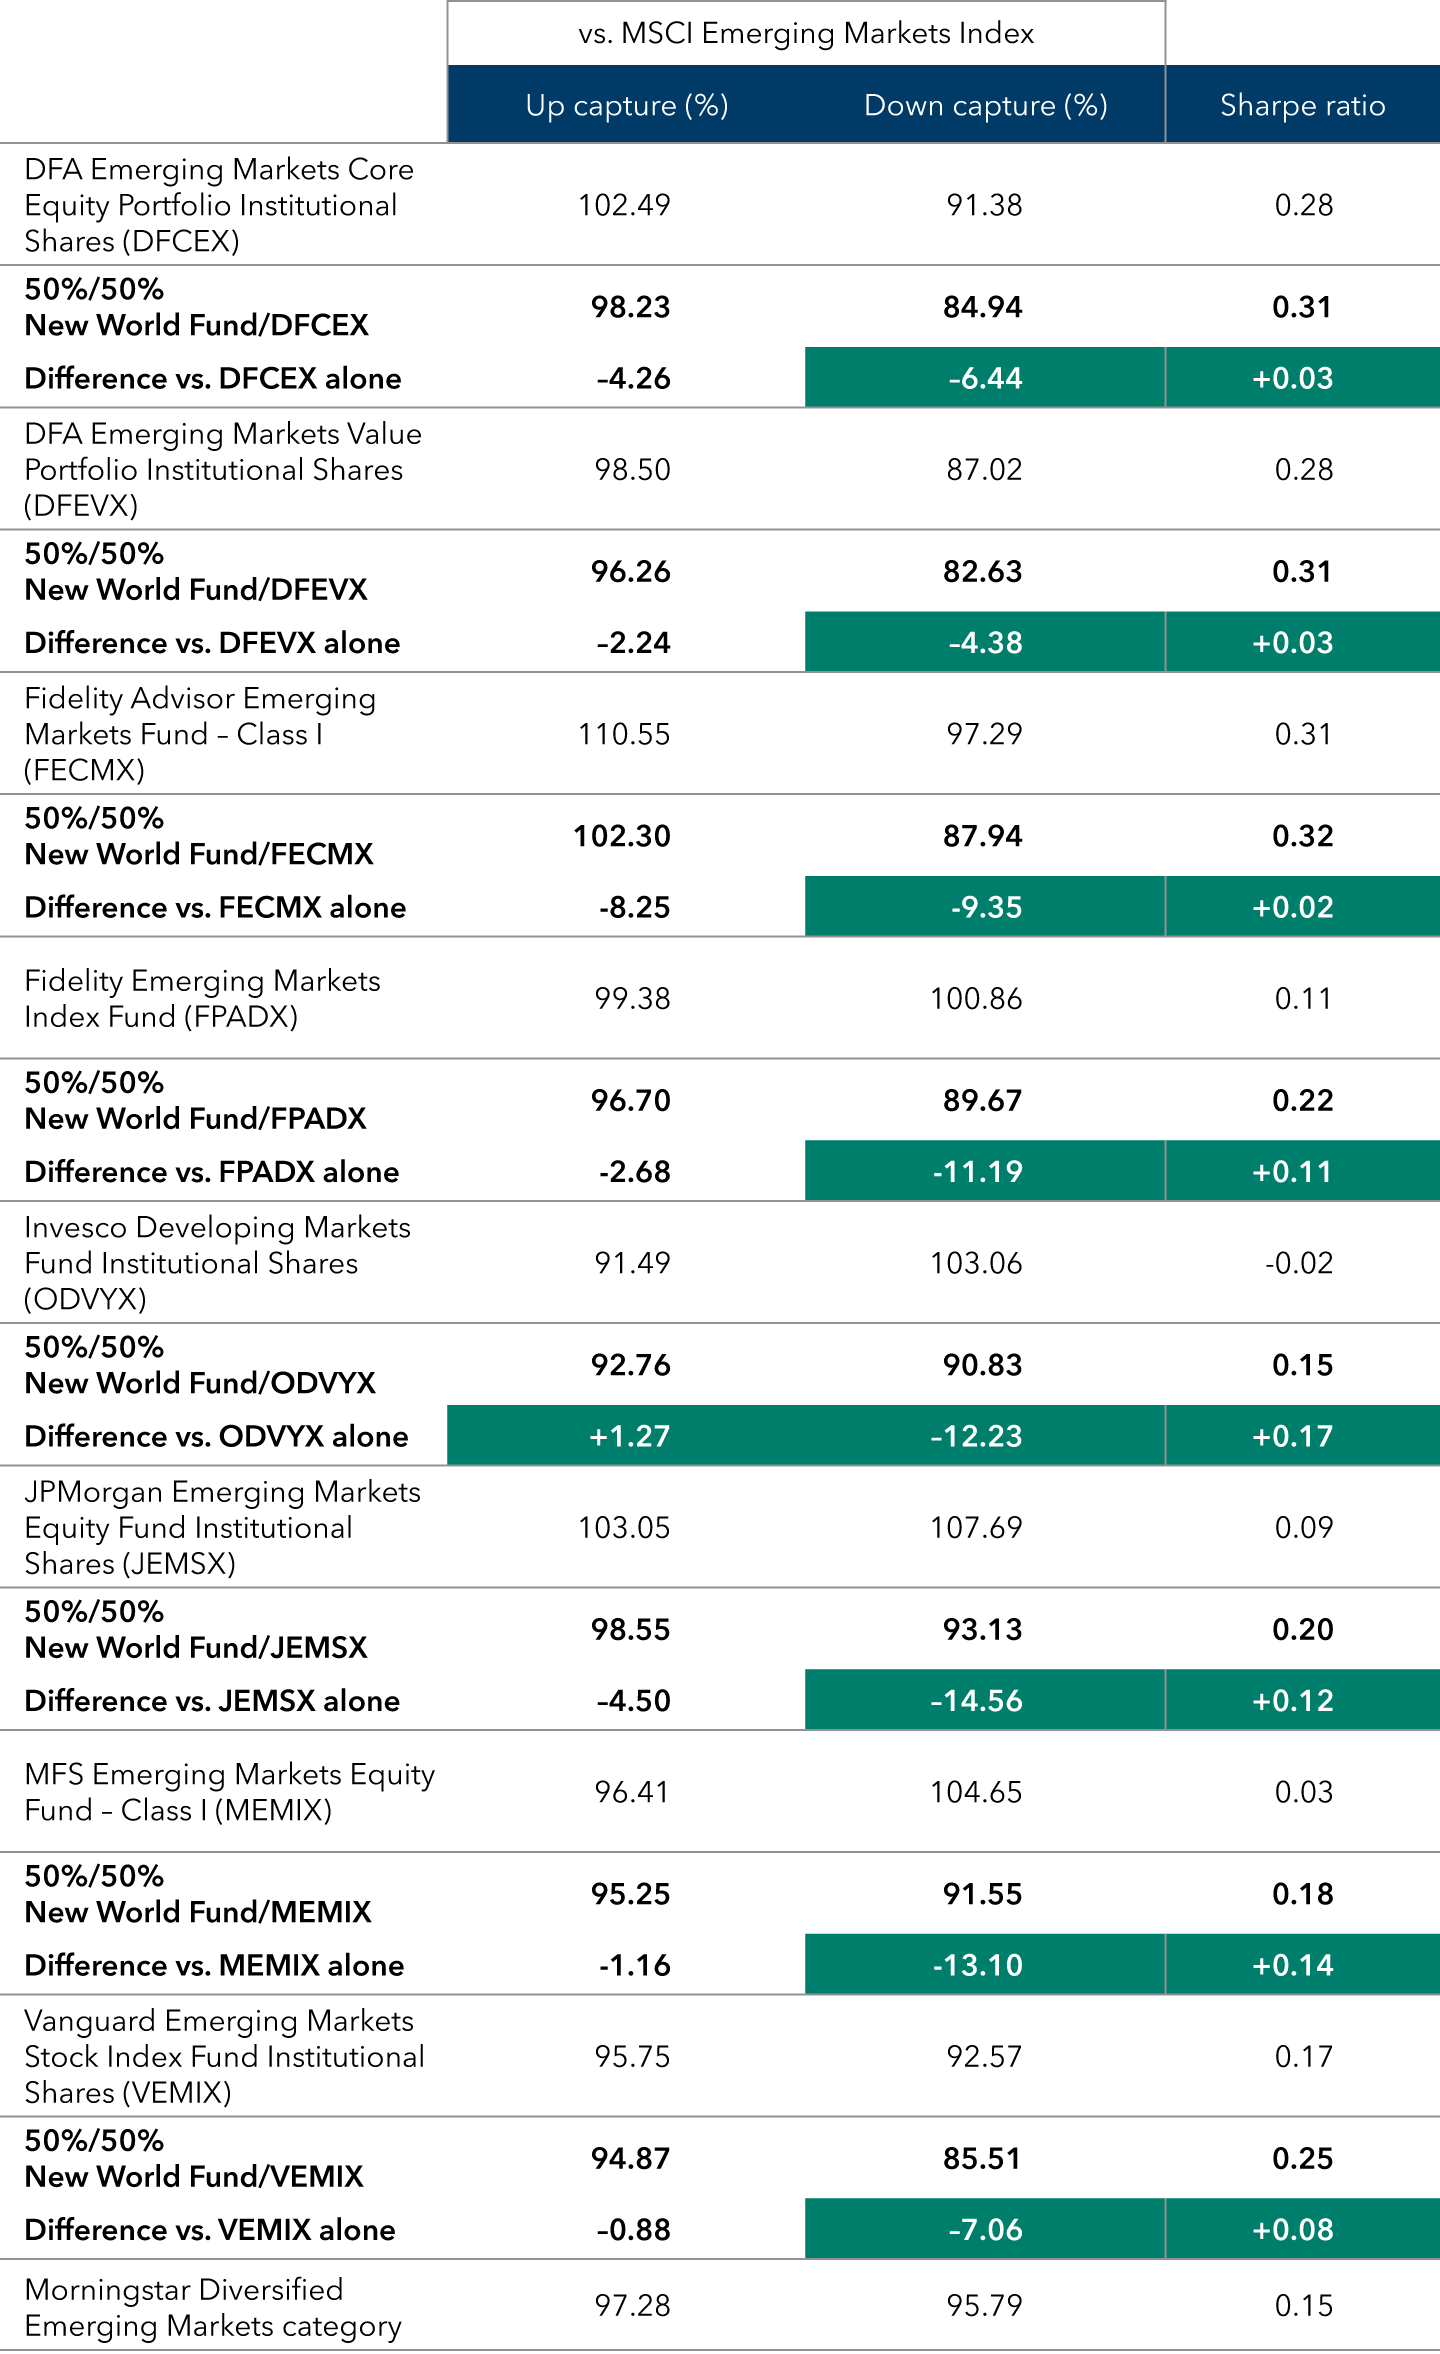
We paired New World Fund (F-2 shares) with competitor mutual funds in a series of hypothetical 50/50 emerging markets portfolio sleeves using institutional shares (which are similar to the F-2 share class of New World Fund used in this comparison).2 We picked competitors that represented a mix of passive indexing strategies and active strategies. In every hypothetical pairing in the exhibit below, the advantage was clear: while up capture ratios would have lagged in most instances, 50/50 sleeves that included New World Fund would have had reduced volatility via improved down capture against MSCI Emerging Markets Index and would have had better Sharpe ratios on both 5- and 10-year timeframes compared with an emerging markets allocation composed of only the competitor funds.
Vanguard Emerging Markets Stock Index Fund is a passive fund that benchmarks to the FTSE Emerging Markets All Cap China A Inclusion Index. Fidelity Emerging Markets Index Fund is a passive fund that benchmarks to the MSCI Emerging Markets Index. Fidelity Advisor Emerging Markets Fund is an actively managed fund that seeks capital appreciation. DFA Emerging Markets Core Equity Portfolio and DFA Emerging Markets Value Portfolio are both actively managed funds that seek long-term capital appreciation with a tilt toward “value” style investing in the latter. Invesco Developing Markets Fund is an actively managed fund that seeks capital appreciation. JPMorgan Emerging Markets Equity Fund is an actively managed fund that seeks to provide high total return. MFS Emerging Markets Equity Fund is an actively managed fund that seeks capital appreciation. All competitors mentioned here benchmark to the MSCI Emerging Markets Index other than Vanguard Emerging Markets Stock Index Fund. In comparison, New World Fund is an actively managed mutual fund that seeks long-term capital appreciation. While New World Fund benchmarks to the MSCI All Country World Index (ACWI), analysis in this piece uses the MSCI Emerging Markets Index since it is a more common benchmark for competitor funds and emerging markets allocators.
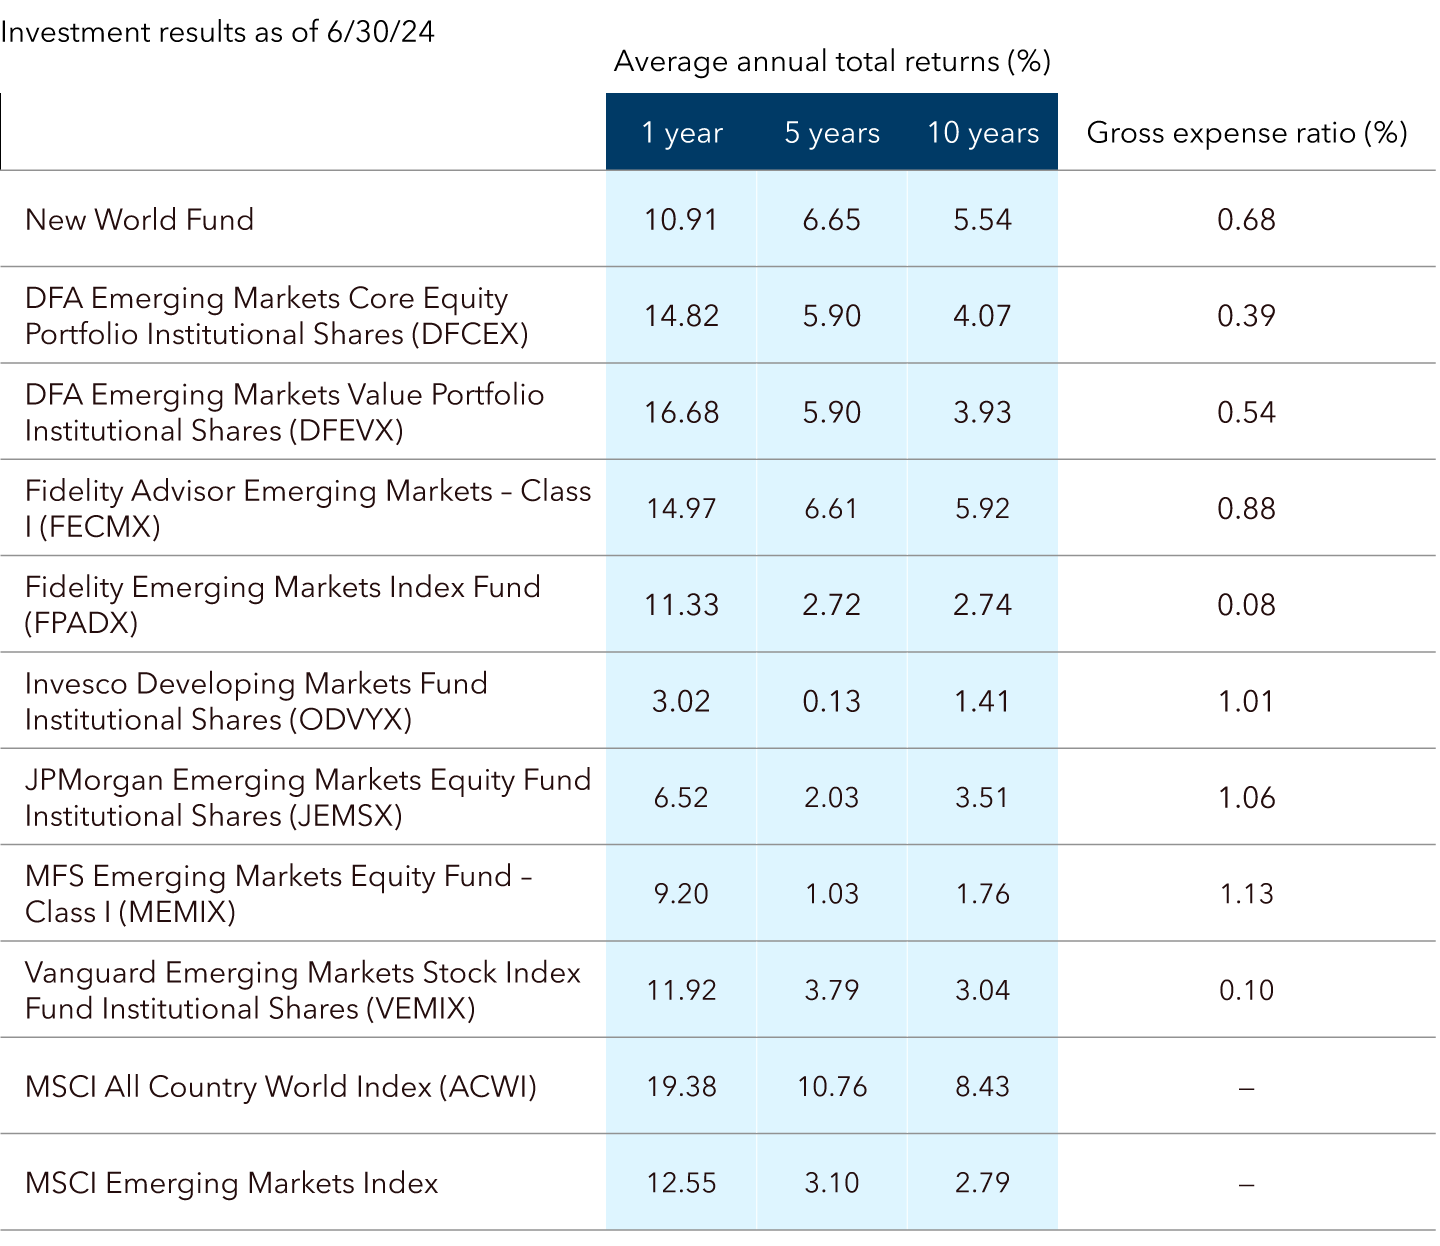
Competitor analysis in this piece uses institutional shares (except for Fidelity Emerging Markets Index Fund, which only offers one share class). Like F-2 shares, institutional shares do not carry a sales load, but there are ongoing expenses, and this is also true for Fidelity Emerging Markets Index Fund. The expense ratios of these funds vary, and they are included at the bottom of this piece. Holdings data such as country exposure also vary, particularly among active funds that do not seek to replicate benchmark exposure. It is important for investors to understand differences in costs and objectives while considering this analysis. Please refer to each fund’s prospectus and the fund details pages linked below for more information about and the latest expense ratios and returns from these competitor funds:
- DFA Emerging Markets Core Equity Portfolio Institutional Shares (DFCEX)
- DFA Emerging Markets Value Portfolio Institutional Shares (DFEVX)
- Fidelity Advisor Emerging Markets Fund – Class I (FECMX)
- Fidelity Emerging Markets Index Fund (FPADX)
- Invesco Developing Markets Fund Institutional Shares (ODVYX)
- JPMorgan Emerging Markets Equity Fund Institutional Shares (JEMSX)
- MFS Emerging Markets Equity Fund – Class I (MEMIX)
- Vanguard Emerging Markets Stock Index Fund Institutional Shares (VEMIX)
New World Fund would have improved 10-year down capture and Sharpe ratios when paired with competitors

Source: Morningstar. Data covers time period from 7/1/14 to 6/30/24. Totals may not reconcile due to rounding.
New World Fund would have improved 5-year down capture and Sharpe ratios when paired with competitors

Data covers time period from 7/1/19 to 6/30/24. Totals may not reconcile due to rounding.
Compared with the Morningstar Diversified Emerging Markets Category peer group average, New World Fund has had better down capture ratios over the past 5 and 10 years (F-2 shares, as of 6/30/24). That resilient approach may trail in a risk-on environment, but still produced better risk-adjusted results through a full cycle, as measured by the fund’s Sharpe ratios compared with MSCI Emerging Markets Index and Morningstar category peer average on 5- and 10-year time frames.
For investors willing to forgo some up capture, historical resiliency may help to strengthen the backbone of an emerging markets sleeve. New World Fund can serve as the core in the emerging markets sleeve, around which additional strategies can be added to the portfolio. In a risk-on environment, for example, allocators may wish to include an emerging markets strategy that focuses on a specific country, sector or theme. Conversely, when allocators are cautious about emerging markets, they can scale back their “pure” tactical exposure in favor of New World Fund’s historically less volatile approach to emerging markets.
New World Fund had less volatility over the past 5 and 10 years than its peer group average

Source: Morningstar. Chart compares capture ratios of New World Fund and the Morningstar Diversified Emerging Markets Category average against the MSCI Emerging Markets Index. The 10-year data covers the time period from 7/1/14 to 6/30/24, and the 5-year data covers the time period from 7/1/19 to 6/30/24. Totals may not reconcile due to rounding.
New World Fund’s emerging markets holdings outpaced the index
At first glance, it may seem that the results of New World Fund were largely impacted by its exposure to multinationals domiciled outside of emerging markets. However, we can strip out the impact of those developed markets companies to find that New World Fund’s emerging markets holdings outpaced the MSCI Emerging Markets Index.
In the past 10 years ended June 30, 2024, New World Fund’s emerging markets investments returned 54.24% cumulatively, with dividends reinvested gross of fees. That’s more than 20 percentage points better than the MSCI Emerging Markets Index, which returned 31.70% in the same period.
New World Fund’s emerging markets holdings outpaced the MSCI Emerging Markets Index

Source: Capital Group. The data covers the time period from 7/1/14 to 6/30/24. The emerging markets region accounted for an average of 42.80% of New World Fund’s portfolio in the period covered. Other regions in the portfolio were the U.S. (19.73%), eurozone (10.51%), other Europe (4.37%), Japan (4.26%), Canada (1.05%), Pacific ex-Japan (4.85%) and the U.K. (4.36%). The fund also held cash at an average of 8.06% of the portfolio. Totals may not reconcile due to rounding. “New World Fund’s emerging markets holdings” does not include expenses, and if fees had been deducted, results would be lower. Investors cannot invest directly in the New World Fund emerging markets holdings.
Why New World Fund now
Allocators should consider an allocation to some emerging markets exposure in their portfolios for the benefits that have historically come with maintaining diversified portfolios, and because the space has the potential to surprise investors. Market movements in both China and India this year exemplify this element of surprise.
Here in the U.S., the potential for a slowing economy and falling rates could put downward pressure on the U.S. dollar. Historically, a falling dollar has benefited international stocks, reducing costs for companies overseas that depend on U.S. goods or have dollar-denominated loans. This could create opportunities for investors, especially when combined with the lower debt levels, falling inflation and strong balance sheets in companies across the emerging markets space.
Capital Group created New World Fund to help investors seize opportunities with exposure to the emerging markets space while seeking to reduce the volatility that can come from negative shocks on the downside.
For roughly 15 years, emerging markets have trailed developed markets in rolling monthly 10-year annualized returns.1 Markets tend to mean-revert at some point, but there’s no guarantee about when such a reversion could occur. Investors should consider maintaining constant exposure to the space to ensure they’re not left behind if emerging markets begin to outpace.
Vehicle options make emerging markets investing easier than ever
On June 27, Capital Group rolled out its latest wave of active exchange-traded funds (ETFs). Among them was CGNG – Capital Group New Geography Equity ETF. CGNG takes a similar approach to emerging markets investing as New World Fund, but CGNG does not hold fixed income, while New World Fund held 3.4% bonds as of 6/30/24. ETFs are also different investment vehicles than mutual funds. See below for a more comprehensive overview of how these two vehicles differ in taxation, trading and more.3 For those who prefer the tax efficiency and tradability offered by an ETF, they can now implement CGNG’s multi-pronged approach to emerging markets investing through this vehicle.
As a mutual fund, New World Fund has offered a strong emerging markets core with a history of resiliency. With either vehicle serving as the constant core in a portfolio, allocators can use more concentrated strategies to express specific convictions, whether that means adding more “pure” emerging markets exposure, adding country-specific funds or dialing back their exposure to concentrated strategies to express caution.

Source: Capital Group.
Read all perspectives on equity markets
1Emerging markets are represented by the MSCI Emerging Markets Index, and developed markets are represented by both the MSCI EAFE (Europe, Australasia, Far East) Index and the S&P 500 Index. Emerging markets outpaced developed markets in the 10-year period from January 1, 2000, through December 31, 2009. Developed markets outpaced emerging markets in 100% of rolling monthly 10-year periods beginning 7/1/2009 and ending 6/30/24.
2As of June 30, 2024, the competitor funds chosen were among the 13 largest funds in the Morningstar Diversified Emerging Markets category with at least 10 years of history. Funds of funds or funds only offered as an underlying investment in a fund of funds were excluded from this analysis.
3ETF shares are bought and sold through an exchange, like a stock, and trading can happen throughout the day while the exchange is open. Mutual funds do not trade throughout the day, and any orders from the day execute after market close. Mutual fund prices are set by the net asset value (NAV) of the fund’s assets, whereas an ETF’s price is determined by market trading, and it may deviate from the NAV of the ETF’s assets.

