Finding stability amid changing global economic leaders
KEY TAKEAWAYS
  • Every decade has presented a largely new set of global leaders
  • New Perspective Fund Historical Benchmarks Index, comprised of the MSCI World Index and MSCI All Country World Index, led most of the leaders in every time period
  • New Perspective Fund (at F-2 shares) beat its benchmark index in all of these time periods

Read important investment disclosures


There’s no doubt that the Magnificent 7* (Alphabet, Amazon, Apple, Meta Platforms, Microsoft, NVIDIA and Tesla) have been dominant in recent years, but history has taught us that over time, market leadership has had a tendency to change, as has regional leadership.


For example, between the 1980s and the 1990s, 6 of the top 10 leaders by market cap changed from those domiciled in the United States and Europe over to those domiciled in Japan. And 10 years after that, there was only one Japanese company still in the top 10.
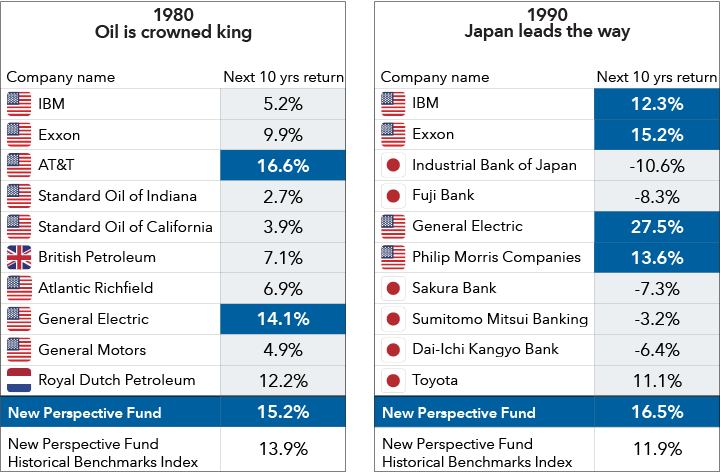

Tables with the 10 most valuable public companies in the world at the start of each decade for 1980 and 1990, along with their next 10 years return. The next 10 years return for New Perspective Fund and the New Perspective Fund Historical Benchmarks Index over the same period are included for comparison. The 1980 list is labeled “Oil is crowned king” as 6 of the 10 companies are oil producers. However, just two companies, AT&T and General Electric, would beat the return of the New Perspective Fund Historical Benchmarks Index over the next decade, and only AT&T would outpace New Perspective Fund. The 1990 list is labeled “Japan leads the way” as it now features six Japanese companies. Of the companies among the top 10 for 1980, just three — IBM, General Electric and Exxon — were still among the 10 most valuable companies in 1990. Only those three would have better returns than New Perspective Fund Historical Benchmarks Index over the next 10 years, and New Perspective Fund would return more than all but General Electric.

These tables show the 10 most valuable public companies by market capitalization in the world at the start of each decade along with their next 10 years return.

Source: Capital Group. As of December 31, 2023. “Next 10 yrs return” refers to the average annual total return of the stock or index from the current decade's beginning observation date to the beginning of the next decade. Observation date for each set of holdings is December 31 of the year. For example, for 1980, the observation date for the largest companies is 12/31/1980. The exception is for 2000, which uses the observation date of 2/28/2000, as it reflects the closest month-end peak of the tech bubble. 

In the late 1990s, many companies’ stock valuations lifted during the dot-com boom, but the growth was stunted after the bubble burst. Then in the 2010s, several Chinese companies cracked the top 10, but only 3 of the 10 were able to outpace the index.
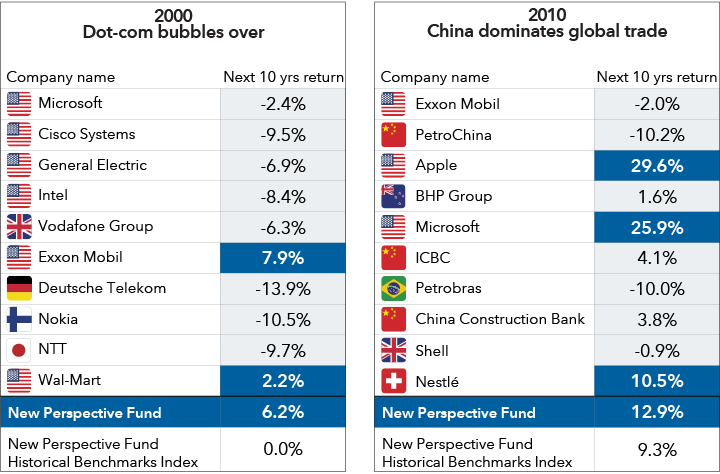

Tables with the 10 most valuable public companies in the world at the start of each decade for 2000 and 2010, with 2000’s label being “Dot-com bubbles over.” Of these, just NTT is Japanese, and it was not among the six Japanese companies from 1990. The only two companies to remain in the top 10 from 1990 to 2000 would be General Electric and Exxon, though the latter changed to Exxon Mobil following its merger. Of these 10 companies, just Exxon Mobil and Wal-Mart exceed the returns of the New Perspective Fund Historical Benchmarks Index over the next decade, and only Exxon Mobil returned more than New Perspective Fund. The 2010 list is labeled “China dominates global trade,” and it includes three Chinese companies. Only Exxon Mobil and Microsoft remained from the prior decade’s top 10. Only three companies — Apple, Microsoft and Nestlé — had higher returns through the end of 2019, and only Apple and Microsoft had higher returns than New Perspective Fund over the same period.

These tables show the 10 most valuable public companies by market capitalization in the world at the start of each decade along with their next 10 years return.

Source: Capital Group. As of December 31, 2023. “Next 10 yrs return” refers to the average annual total return of the stock or index from the current decade's beginning observation date to the beginning of the next decade. Observation date for each set of holdings is December 31 of the year. For example, for 1980, the observation date for the largest companies is 12/31/1980. The exception is for 2000, which uses the observation date of 2/28/2000, as it reflects the closest month-end peak of the tech bubble. 

This underlines the importance of deep research and thoughtful stock selection to find consistent value, even when economic environments shift and the top companies lose favor. Time will tell if this remains true for the current decade, but it’s already clear that the leaders are following the trend of trading top positions.
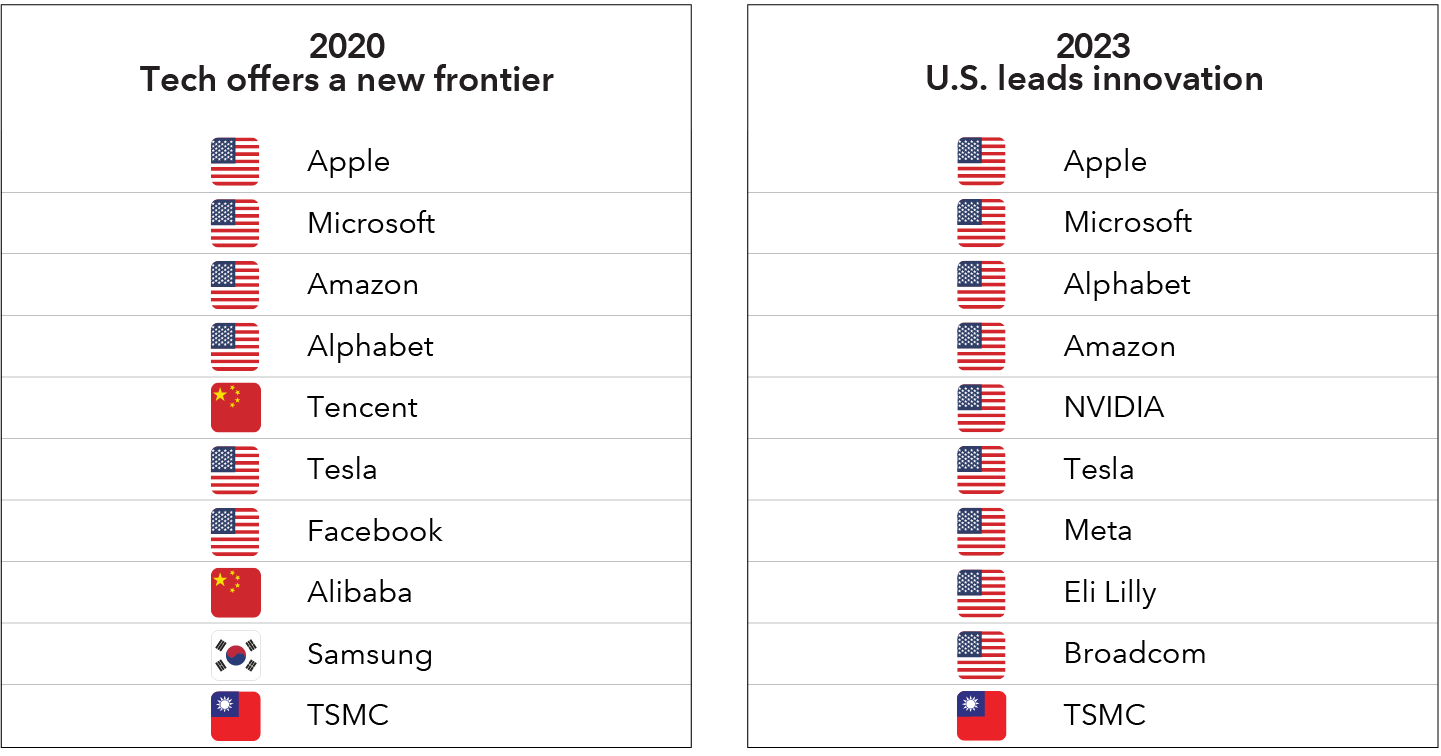

Tables with the 10 most valuable public companies in the world at the end of each year for 2020 and 2023, with 2020 labeled as “Tech offers a new frontier,” as all 10 companies could be defined as tech firms. There are two Chinese companies, though neither were among the three on the list in 2010. In fact, the only companies to carry over from the 2010 list are Apple and Microsoft. Updating that list for 2023, the list is labeled “U.S. leads innovation” as the two Chinese companies from 2020 — Tencent and Alibaba — are no longer in the top 10, and Taiwanese semiconductor company TSMC is the only non-American company among the world’s 10 most valuable.

These tables show the 10 most valuable public companies by market capitalization in the world at the start of each respective decade.

Source: Capital Group. As of December 31, 2023. Observation date for each set of holdings is December 31 of the year. For example, for 1980, the observation date for the largest companies is 12/31/1980. The exception is for 2000, which uses the observation date of 2/28/2000, as it reflects the closest month-end peak of the tech bubble. 

For a flexible global approach to broader market exposure and diversification, investors may consider New Perspective Fund and CGGO Capital Group Global Growth Equity ETF as potential investment options.


* The "Magnificent 7" refers to a group of seven major technology stocks that had a significant impact on the market in 2023. These stocks are Apple, Microsoft, Alphabet, Amazon, NVIDIA, Meta Platforms and Tesla.

Figures shown are past results and are not predictive of results in future periods. Current and future results may be lower or higher than those shown. Investing for short periods makes losses more likely. Prices and returns will vary, so investors may lose money. View mutual fund expense ratios and returns.
Investments are not FDIC-insured, nor are they deposits of or guaranteed by a bank or any other entity, so they may lose value.
Investors should carefully consider investment objectives, risks, charges and expenses. This and other important information is contained in the fund prospectuses and summary prospectuses, which can be obtained from a financial professional and should be read carefully before investing.
Investing outside the United States involves risks, such as currency fluctuations, periods of illiquidity and price volatility. These risks may be heightened in connection with investments in developing countries.
There have been periods when the results lagged the index(es) and/or average(s). The indexes are unmanaged and, therefore, have no expenses. Investors cannot invest directly in an index.
MSCI has not approved, reviewed or produced this report, makes no express or implied warranties or representations and is not liable whatsoever for any data in the report. You may not redistribute the MSCI data or use it as a basis for other indices or investment products.
All Capital Group trademarks mentioned are owned by The Capital Group Companies, Inc., an affiliated company or fund. All other company and product names mentioned are the property of their respective companies.
Investment results assume all distributions are reinvested and reflect applicable fees and expenses.
Certain share classes were offered after the inception dates of some funds. Results for these shares prior to the dates of first sale are hypothetical based on the original share class results without a sales charge, adjusted for typical estimated expenses. 
  • Class F-2 shares were first offered on 8/1/2008.
Results for certain funds with an inception date after the share class inception also include hypothetical returns because those funds' shares sold after the funds' date of first offering. View dates of first sale and specific expense adjustment information.
Use of this website is intended for U.S. residents only.
Capital Client Group, Inc.
This content, developed by Capital Group, home of American Funds, should not be used as a primary basis for investment decisions and is not intended to serve as impartial investment or fiduciary advice.

New Perspective Fund Historical Benchmarks Index returns reflect the results of the MSCI World Index from 3/13/1973 through 9/30/2011 and the MSCI All Country World Index, the fund's current primary benchmark, thereafter.

MSCI All Country World Index is a free float-adjusted market capitalization weighted index that is designed to measure equity market results in the global developed and emerging markets. The index consists of more than 40 developed and emerging market country indexes. Results reflect dividends net of withholding taxes.

MSCI World Index is a free float-adjusted market capitalization weighted index that is designed to measure equity market results of developed markets. The index consists of more than 20 developed market country indexes, including the United States. Results reflect dividends net of withholding taxes. This index is unmanaged, and its results include reinvested dividends and/or distributions but do not reflect the effect of sales charges, commissions, account fees, expenses or U.S. federal income taxes.