Chart in Focus
Portfolio Construction
- Advisors should seek to understand client goals in addition to their risk tolerance.
- Risk should be viewed not just through the lens of volatility, but also in context of the likelihood of undershooting goals.
- Because risks vary between the accumulation and retirement phases, so should portfolio construction.
- Investors can mitigate risk not only by reducing the amount of equity, but also by changing the types of equity.
- Fund attributes of downside capture and long-horizon risk are important, and can help improve investor outcomes.
In the world of financial advice, we are seeing a welcome trend toward goals-based wealth management. This trend puts a greater focus on the goals that investors want to achieve with their savings — such as retirement security, paying for college or purchasing a home — and uses these goals to drive investment strategy and monitor progress. The use of the term “objective-based investing” refers to the investment strategies that seek to achieve investors’ goals.
Objective-based investing may seem like an obvious concept, but it represents a departure from the typical risk-tolerance framework, which profiles clients primarily based on whether they have a conservative, moderate or aggressive orientation to investment risk. It turns out that a simple question — what’s most risky — might have a surprisingly nuanced answer depending on the investment and savings goals of an investor.
Risk is not just volatility.
To see objective-based investment management in action, consider a highly simplified example using long-term historical results for three different stock indexes: a large-cap index often used to represent “the market,” a small-cap index, and a dividend-payers index, all measured over the period from 1976 to 2016. The indexes used were selected for their longevity and for purposes of illustrating differing characteristics among types of equities.

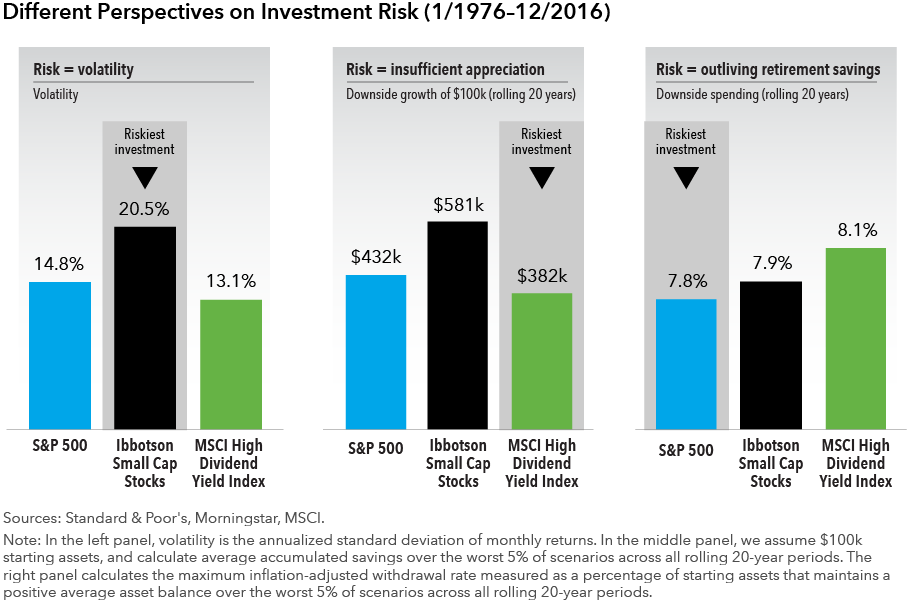
Risk is traditionally measured as annualized volatility, or the annualized standard deviation of monthly returns. In this example, Ibbotson Small Cap stocks had the highest annualized volatility and so might be considered most risky.
An objective-based approach might yield a very different perspective. Consider a worker seeking to invest $100,000 toward retirement in 20 years. Her greatest fear is that of insufficient capital appreciation, and therefore she seeks the maximum growth in her investment. In the center chart in the exhibit above, we calculated the average accumulated savings in the worst 5% of all rolling 20-year periods (from 1976 to 2016). This lens suggests that the small cap investment was the least risky, as it returned approximately $581,000 over the least favorable 20-year periods. The dividend-payers index, in contrast, generated only $382,000, on average.
Finally, consider an older retiree seeking the greatest degree of sustainable spending over a 20-year period — what we call the downside withdrawal rate. Any higher withdrawal rate would result in a negative average account balance in the worst 5% of scenarios across rolling 20-year periods. These downside withdrawal rates, at greater than 7%, seem higher than the more standard 3% to 5% withdrawal rates developed from research by William Bengen. This is due to a 20-year retirement horizon considered, the favorable market environment from 1976 to 2016 (with double-digit average equity returns), and because we use an all-equity strategy for simplicity of presentation.
This investor might perceive the dividend-payers index, at 8.1%, to be the safest option, since it would support a higher maximum withdrawal rate over these worst-case periods. The large-cap index would have been the least attractive investment for a retiree since the safest maximum withdrawal rate, 7.8%, was nearly a half a percent less per year than the dividend-payers option. While conventional wisdom suggests that the broad, market-cap weighted portfolio is most diversified, it may not have the lowest risk for all investors.
If not volatility, then what?
Early research on asset allocation argued that investment choice is simply a tradeoff between expected return and volatility, if asset returns are symmetrical (bell shaped) and independent through time (Samuelson, 1963; Campbell & Viceira, 2001).
Both assumptions seem straightforward but, as research has shown, these assumptions rarely hold in practice (Pettengill, Sundaram, & Mathur, 1995; Lettau & Wachter, 2007).
Investors in high-yield bonds receive a periodic coupon, but could lose all their money if the firm borrowing money defaults. Similarly, the value of a 10-year Treasury note can fluctuate significantly over short periods of time, but it offers a certain (risk-free) payout over a 10-year period.
More importantly, departures from typical assumptions have a critical impact on investment suitability. Large losses are compounded in retirement as periodic withdrawals become larger proportions of declining assets, and can cause permanent depletion. Conversely, investors saving for retirement have longer holding periods, and can afford to ride out periods of temporary stress.
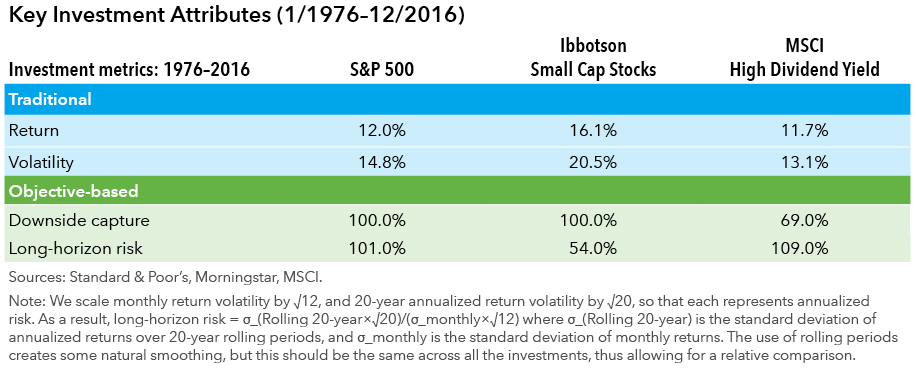
The table below captures these key aspects of investment results for the three indexes considered. We report “traditional” measures of average return and volatility, along with two additional “objective-based” metrics. First, downside capture measures the average return of each of the indexes in periods where the market (defined here as the S&P 500) has negative returns, and is an intuitive way to understand potential for large losses. The MSCI USA High Dividend Yield Index has only 69% downside capture, compared to 100% for Ibbotson Small Cap, and so it naturally offered lower risk of asset depletion from withdrawals.

Second, long-horizon risk is the ratio of the volatility calculated using 20-year annualized returns to the volatility calculated using monthly returns. This provides an intuitive understanding of mean reversion and how volatility may smoothen out over longer periods of time. Values less than 100% imply less risk over longer holding periods, and values greater than 100% imply more risk over longer holding periods.
The Ibbotson Small Cap Index has had long-horizon risk of 54%, illuminating why, despite higher short-term volatility, it produced excellent outcomes for investors accumulating savings. These measures have historically been confined to academic discourse; our research suggests that they should become more mainstream (Ramkumar, Hammond, & Bell, 2017).
Expanding conventional practice
Our case studies are not meant to be recommendations of which asset class or index to invest in. In fact, the results can vary depending on the index used, and index characteristics themselves can change through time. For example, the downside capture of the MSCI High Dividend Yield Index increased materially during the credit crisis. Our objective instead is to highlight why it is important for advisors to reframe the portfolio construction conversation around client goals, and how advisors can expand on traditional practice. This summarized in the table below:
How to expand portfolio construction in an objective-based framework

First, investors and their advisors should view risk not just as annual volatility of portfolios, but instead as the likelihood of undershooting goals. It is not enough to evaluate a client’s risk tolerance in the abstract. Instead, risk is inextricably linked to one’s goals, time horizon and life stage.
Second, just as investment risk varies with client goals, so too must the investment approach. As an example, portfolio construction for a client saving for retirement should employ investments that are different than for a client living in retirement. Investors have traditionally sought to reduce risk by simply reducing the amount of equity. Our research suggests there is value in also changing the type of equities.
Lastly, advisors usually select strategies that seek to match or beat market benchmarks. Our research suggests that they should also evaluate attributes like downside capture and long-horizon risk, which can positively impact investor outcomes.
These adjustments may seem daunting, but they are built on research that spans several decades and represent a clearer perspective on portfolio construction. They offer the opportunity for better client engagement and, most importantly, the potential for improved investor outcomes.
Works cited
Campbell, John Y. and Luis M. Viceira, “Strategic Asset Allocation: Portfolio Choice for Long-Term Investors,” Oxford University Press, New York, NY, 2001.
Lettau, Martin, and Jessica A. Wachter, “Why Is Long-Horizon Equity Less Risky? A Duration-Based Explanation of the Value Premium,” Journal of Finance, American Finance Association, Vol. 62, No. 1, pages 55–92, February 2007.
Pettengill, G., S. Sundaram, and I. Mathur, “The Conditional Relation Between Beta and Returns,” Journal of Financial and Quantitative Analysis 30, No. 1 (March), pages 101–116, 1995.
Ramkumar, Sunder R., P. Brett Hammond and Clyde Bell, “Which Fund Attributes Matter for Goals-Based Investors,” Investment and Wealth Monitor, 2017.
Samuelson, Paul A., “Risk and Uncertainty: A Fallacy of Large Numbers,” 1963.Past results are not predictive of results in future periods.
MSCI does not approve, review or produce reports published on this site, makes no express or implied warranties or representations and is not liable whatsoever for any data represented. You may not redistribute MSCI data or use it as a basis for other indices or investment products.
© 2017 Morningstar, Inc. All rights reserved. The information contained herein: (1) is proprietary to Morningstar and/or its content providers; (2) may not be copied or distributed; and (3) is not warranted to be accurate, complete or timely. Neither Morningstar nor its content providers are responsible for any damages or losses arising from any use of this information. Past performance is no guarantee of future results.
The S&P 500 Composite Index (“Index”) is a product of S&P Dow Jones Indices LLC and/or its affiliates and has been licensed for use by Capital Group. Copyright © 2018 S&P Dow Jones Indices LLC, a division of S&P Global, and/or its affiliates. All rights reserved. Redistribution or reproduction in whole or in part are prohibited without written permission of S&P Dow Jones Indices LLC.
Our latest insights
-
-
Economic Indicators
-
Demographics & Culture
-
Emerging Markets
-
RELATED INSIGHTS
-
Artificial Intelligence
-
Portfolio Construction
-
Never miss an insight
The Capital Ideas newsletter delivers weekly insights straight to your inbox.
Statements attributed to an individual represent the opinions of that individual as of the date published and do not necessarily reflect the opinions of Capital Group or its affiliates. This information is intended to highlight issues and should not be considered advice, an endorsement or a recommendation.
 Sunder Ramkumar
 Brett Hammond