Markets & Economy
Portfolio Construction
The last 18 months have been a wild ride for investors. It started with the fastest stock market decline and recovery in history. Next came a rotation to cyclicals and back again. And over the last several months the looming threat of inflation and rising rates has spooked markets.
Investors who aren’t regularly reviewing their holdings may find that their portfolio has become unbalanced and is no longer in line with their investment goals. That’s what Capital Group’s Portfolio Consulting and Analytics team found after reviewing more than 1,400 portfolios over the first half of the year. Here are four actions you may want to consider as you evaluate your own portfolio and try to get it back on track over the remainder of the year.
1. Check if you have enough dividend income
To many investors, dividends have lost some of their luster in recent years, overshadowed by the meteoric rise of tech and other digital companies. Although dividend-paying stocks may not have the same sizzle as an investment in growth sectors or Bitcoin, they should remain a staple within most portfolios. This is especially true if you are closer to retirement or have low to moderate risk tolerance.
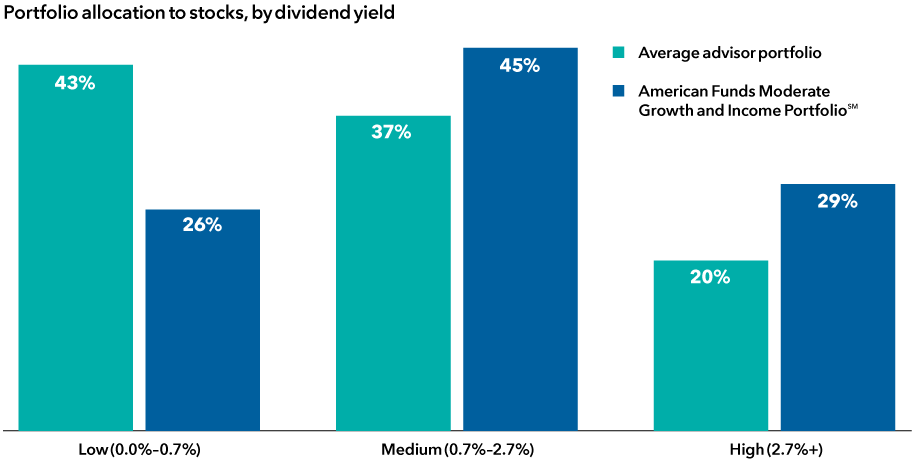
However, our team observed that the average professionally managed portfolio had a low allocation to dividend-paying companies. Within these portfolios, 43% of equities were allocated to stocks that had a dividend yield of 0.7% or less. By comparison, American Funds Moderate Growth and Income PortfolioSM, held just 26% of its equities in low-yielding stocks. It’s important to note that American Funds Moderate Growth and Income Portfolio has a stated objective of providing current income and long-term growth of capital and income, whereas the professionally managed portfolios that the team analyzed include a wider range of investment objectives and holdings.
Many portfolios are dominated by low dividend payers

Source: Capital Group. As of 6/30/21.
For many investors, the search for dividend income might naturally start with companies that pay the highest yields. These companies can be sound investments, but the high yield can also be a warning sign.
“Companies that have very high dividends to start may not be able to sustain them,” notes Joyce Gordon, a portfolio manager for Capital Income Builder® and American Mutual Fund®. “The high yield may indicate a company is a melting ice cube, and their business is in decline and they're not reinvesting.”
Instead, Gordon prefers to seek out dividend growers — strong companies that she believes are likely to be even stronger in five or 10 years.
“I look for a company that can demonstrate the capacity and commitment to raise its dividends over time,” Gordon says. “I look for dividend growth that matches the underlying earnings growth of the company.”
This could be an opportune time to bring more balance to your portfolio if it has been lacking dividend income. Last year was especially tough for dividend payers — 248 U.S. companies cut or suspended their dividends during the year. But the outlook for these companies should be brightening as the economy continues to recover and many are able to reinstate their dividends.
2. Diversify with small caps outside the U.S.
You may not be thinking big enough with your small-cap allocation. Despite the numerous innovative and fast-growing companies around the globe, many portfolios have a notably domestic tilt when it comes to small- and mid-cap investments (SMID).
"Many advisor portfolios are overweight SMID versus global indices, but it's a different story when we look outside the U.S.," says Mark Barile, manager of the Portfolio Consulting and Analytics team. "Financial advisors tend to have very little international SMID exposure."
The team's research discovered that across all portfolios analyzed during the first half of the year just 1.8% of assets were dedicated to global or international small-/mid-cap funds, and 71% of portfolios had no dedicated exposure.
Despite being an often overlooked asset class, international SMID potentially has a lot going for it. Its vast size and relatively low analyst coverage mean active managers may have a better chance of finding value in a less efficient segment of the equity markets. There are more than 2.5 times as many small- and mid-cap companies outside the U.S. as there are domestic, and small caps have nearly four times as much analyst coverage as large caps.
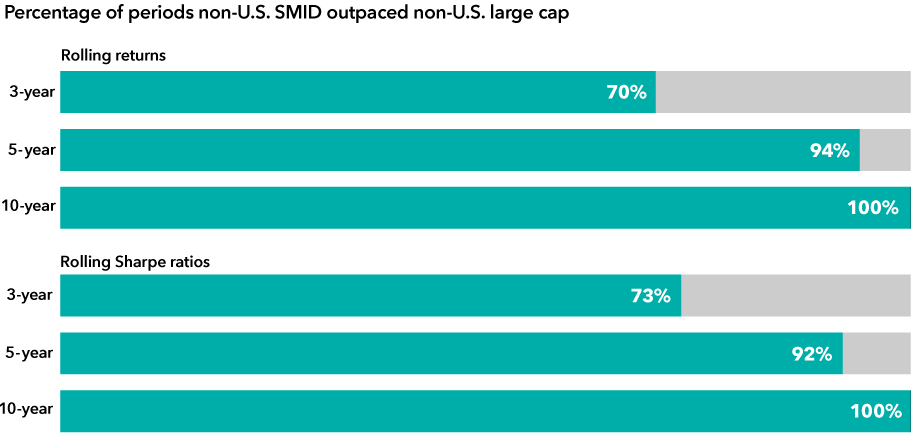
Returns have also been strong compared to large caps. Over the last two decades, non-U.S. SMID has outpaced non-U.S. large caps in most 3-, 5- and 10-year rolling periods, both on an absolute and a risk-adjusted basis.
International SMID has outpaced large caps over the last 20 years

Sources: Morningstar, MSCI, RIMES. Non-U.S. SMID represented by MSCI ACWI ex USA SMID Cap Index. Non-U.S. large cap represented by MSCI ACWI ex USA Large Cap Index. Includes all rolling monthly periods for the 20 years through 6/30/21. Sharpe ratios use standard deviation and excess return to determine reward per unit of risk. The higher the number, the better the portfolio's historical risk-adjusted performance. Rolling returns are averages of an overlapping series of trailing returns going back in time. This added historical perspective may include a wider variety of market environments than trailing returns.
From a portfolio construction standpoint, small-cap funds also tend to have very little overlap with large-cap funds, so including them within a well-balanced portfolio can provide additional diversification benefits. For example, there is less than 10% overlap between the stocks in Capital Group’s SMALLCAP World Fund® and its funds with more of a large-cap focus, such as The Growth Fund of America® and New Perspective Fund®.
Smaller companies tend to be more volatile than their larger counterparts, so investors may want to consider a more moderate allocation to the asset class. But a little extra volatility doesn't necessarily mean that small caps are only appropriate for the growthiest portfolios.
The Capital Group Portfolio Solutions Committee demonstrated this in their recent review of the American Funds Portfolio Series, when they added SMALLCAP World Fund to its Moderate Growth and Income Portfolio for the first time. During the same review, the committee also increased the fund's weight in four other model portfolio allocations, reflecting their conviction that small caps can offer higher risk-adjusted returns to diversified portfolios across multiple investment objectives.
3. Consider more fixed income flexibility
If you're a bond investor and the macro environment is making you uneasy, then you're not alone. Uncertainty around inflation and interest rates topped the list of investor concerns so far this year. Some have questioned whether bonds make sense if rates are set to rise and instead have opted to stay on the sidelines. Others are looking to ride the economic recovery and search for income in high-yield corporate bonds.
"Today when you adjust for ratings and duration, credit spreads are at all-time rich levels, or at least as far back as we have data," says fixed income portfolio manager Pramod Atluri. "I'm quite positive on the outlook for credit, but it's almost the definition of picking up pennies in front of a steamroller."
Rather than sitting on cash or stretching for yield, you may want to consider a more flexible approach to bond investing. Flexible bond funds add versatility and provide managers the ability to pivot to sectors that their research highlights as markets evolve.
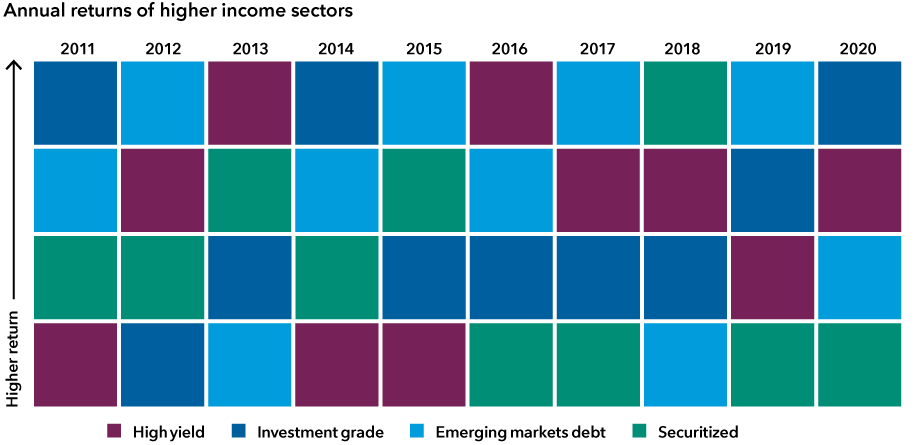
No bond sector has consistently offered the best return each year

Source: Morningstar. As of 12/31/20. Sectors shown represented by Bloomberg Barclays U.S. Corporate High Yield 2% Issuer Capped Index, Bloomberg Barclays U.S. Corporate Investment Grade Index, J.P. Morgan Emerging Markets Bond Index (EMBI) Global Diversified and 80% Bloomberg Barclays CMBS ex AAA Index/20% Bloomberg Barclays ABS ex AAA Index, respectively.
Multisector bond funds such as American Funds Multi-Sector Income FundSM offer an example. As the name implies, these funds provide exposure to a diversified suite of fixed income investments. The best performing bond sector tends to vary from year to year, so a more flexible approach could be a good way of reducing risk while capturing yield. Rather than overweighting in one particular area, especially amid rich valuations, the best opportunity may come from diversification and a more balanced approach.
4. Get a portfolio checkup
Want a more personalized portfolio makeover, but not sure where to begin? If you’re a financial professional interested in getting a checkup on your clients’ portfolios, Capital Group can help. Request a personal consultation from one of our portfolio specialists to help you address your clients’ specific investment needs and goals, preparing them for the years ahead.
Past results are not predictive of results in future periods.
Investing outside the United States involves risks, such as currency fluctuations, periods of illiquidity and price volatility, as more fully described in the prospectus. These risks may be heightened in connection with investments in developing countries.
Small-company stocks entail additional risks, and they can fluctuate in price more than larger company stocks.
The return of principal for bond funds and for funds with significant underlying bond holdings is not guaranteed. Fund shares are subject to the same interest rate, inflation and credit risks associated with the underlying bond holdings. Higher yielding, higher risk bonds can fluctuate in price more than investment-grade bonds, so investors should maintain a long-term perspective. The use of derivatives involves a variety of risks, which may be different from, or greater than, the risks associated with investing in traditional cash securities, such as stocks and bonds.
Bloomberg Barclays U.S. Corporate Investment Grade Index represents the universe of investment grade, publicly issued U.S. corporate and specified foreign debentures and secured notes that meet the specified maturity, liquidity and quality requirements. Bloomberg Barclays U.S. Corporate High Yield 2% Issuer Capped Index covers the universe of fixed-rate, non-investment-grade debt. The index limits the maximum exposure of any one issuer to 2%. Bloomberg Barclays CMBS ex AAA Index tracks investment-grade commercial mortgage-backed securities excluding AAA-rated securities. The index is constructed by grouping individual pools into aggregates or generics based on program, coupon and vintage. Bloomberg Barclays ABS ex AAA Index tracks investment-grade asset-backed securities excluding AAA-rated securities. The index is constructed by grouping individual pools into aggregates or generics based on program, coupon and vintage.
J.P. Morgan Emerging Markets Bond Index (EMBI) Global Diversified is a uniquely weighted emerging markets debt benchmark that tracks total returns for U.S. dollar-denominated bonds issued by emerging markets sovereign and quasi-sovereign entities.
MSCI ACWI ex USA SMID Cap Index captures mid- and small-cap representation across 22 of 23 developed market countries (excluding the U.S.) and 27 emerging markets countries. MSCI ACWI ex USA Large Cap Index captures large-cap representation across 22 of 23 Developed Markets (DM) countries (excluding the U.S.) and 27 emerging markets countries.
Bloomberg® is a trademark of Bloomberg Finance L.P. (collectively with its affiliates, “Bloomberg”). Barclays® is a trademark of Barclays Bank Plc (collectively with its affiliates, “Barclays”), used under license. Neither Bloomberg nor Barclays approves or endorses this material, guarantees the accuracy or completeness of any information herein and, to the maximum extent allowed by law, neither shall have any liability or responsibility for injury or damages arising in connection therewith.
This report, and any product, index or fund referred to herein, is not sponsored, endorsed or promoted in any way by J.P. Morgan or any of its affiliates who provide no warranties whatsoever, express or implied, and shall have no liability to any prospective investor, in connection with this report. J.P. Morgan disclaimer: https://www.jpmm.com/research/disclosures.
©2021 Morningstar, Inc. All rights reserved. The information contained herein: (1) is proprietary to Morningstar and/or its content providers; (2) may not be copied or distributed; and (3) is not warranted to be accurate, complete or timely. Neither Morningstar nor its content providers are responsible for any damages or losses arising from any use of this information. Past performance is no guarantee of future results.
MSCI has not approved, reviewed or produced this report, makes no express or implied warranties or representations and is not liable whatsoever for any data in the report. You may not redistribute the MSCI data or use it as a basis for other indices or investment products.
RELATED INSIGHTS
Never miss an insight
The Capital Ideas newsletter delivers weekly insights straight to your inbox.
 Joyce Gordon
 Pramod Atluri
 Mark Barile