DIVIDENDS

Dividend growth: The special sauce of long-term investing

Ever heard of the Yield Dogs? Neither had Joyce Gordon when, as a young investment analyst in 1990, she was asked by a mentor, portfolio manager George Miller, to help him solve a problem.


“At the time, the analysts covering industries that paid good dividends each made their recommendations in a silo,” recalls Gordon, who was covering savings and loans companies. “He’d hear my idea to invest in a bank, then the utilities analyst’s ideas, then he’d listen to the phone analyst make another recommendation.”


But Miller wanted to compare dividend paying companies across industries so he could identify the best opportunities for the retirees and other income seekers who invested in his fund.


So the analysts compiled key metrics for each company and put them all on one page. They gathered in a conference room to debate the merits of each. Soon the group began meeting every two weeks and taking research trips together.


Thus were born the Yield Dogs, a group of dividend-focused portfolio managers and analysts whose name stands for “Dividends Ought to Grow.” Through the decades, as dividends have come in and out of favor with investors, the Dogs have continued to meet regularly. Today the group has expanded to more than 25, covering companies across all sectors as well as markets outside the U.S.


“Our mission has become more challenging,” Gordon says. “A great many of our investors need income from their investments, and we need many ideas to meet this challenge.”

You've discovered one of Capital Group's 10 investment themes for 2022

Dividends are making a comeback


In fact, the past 18 months have been extremely challenging for the Yield Dogs and any other income-focused investors. The pandemic and global shutdown walloped many areas of the market that pay dividends in 2020, including airlines, hotels, energy and financials. In a spirit of caution — or, in some cases, facing questions of survival — companies suspended or reduced their dividends at historic levels.


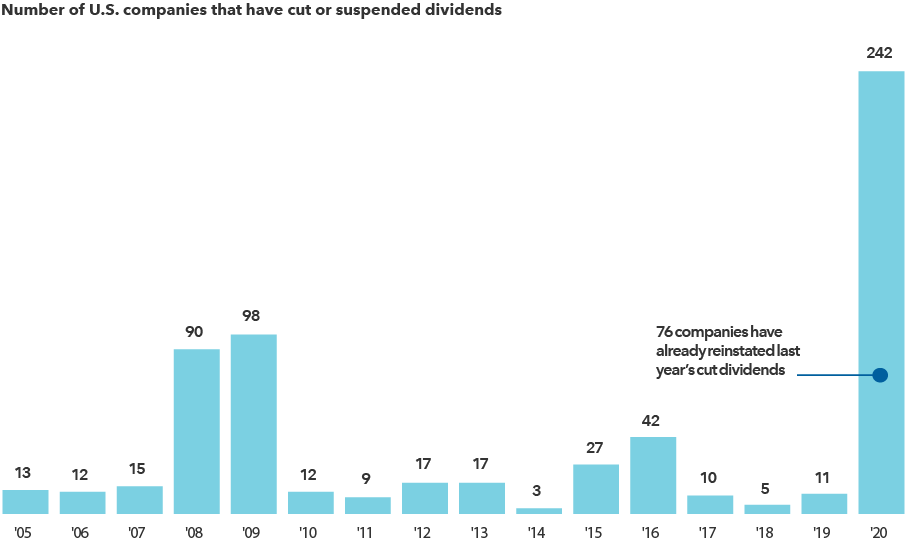
In the U.S. alone, 242 companies cut or suspended dividends, nearly matching the total for the previous 11 years combined. In non-U.S. markets, particularly in Europe, government officials pressured or required some industries to suspend dividend payments during the crisis.


But the picture is brightening. With the rollout of COVID-19 vaccines and the reopening of economies, companies have begun to resume payments. As of May 31, 2021, 76 American companies had reinstated dividends.

After historic cuts, some U.S. companies are restoring dividends

The chart shows the number of U.S. companies that suspended or cut dividends from 2005 through 2020. Only companies with market cap of at least $250 million are included. The cuts and suspensions by year are as follows: 242 in 2020; 11 in 2019; 5 in 2018; 10 in 2017; 42 in 2016; 27 in 2015; 3 in 2014; 17 in 2013; 17 in 2012; 9 in 2011; 12 in 2010; 98 in 2009; 90 in 2008; 15 in 2007; 12 in 2006; and 13 in 2005. The chart also shows that 76 companies that cut or suspended dividends in 2020 have reinstated them as of May 31, 2021. Source: Wolfe Research, LLC.

Source: Wolfe Research, LLC. Copyright © Wolfe Research, LLC 2021. All rights reserved. Only companies with market cap of at least $250 million included. Reinstated dividends statistic is through 5/31/21.

“I am pleased to see that many dividends have been restored, and in many other cases, particularly in Europe, are at least under discussion,” says Gordon, who today is a portfolio manager for Capital Income Builder® and American Mutual Fund®, which both focus on dividends. “I expect many more companies will bring them back in the coming months.”

Dividend growth: The special sauce


For many investors, the search for dividend income might naturally start with companies that pay the highest yields. These companies can be sound investments, but the high yield can also be a warning sign. “Companies that have very high dividends to start may not be able to sustain them,” Gordon notes. “The high yield may indicate a company is a melting ice cube, and their business is in decline and they're not reinvesting.”

Capital Ideas™ webinars

Insights for long-term success
CE credit available

Instead, Gordon prefers to seek out dividend growers — strong companies that she believes are likely to be even stronger in five or 10 years. “I look for a company that can demonstrate the capacity and commitment to raise its dividends over time,” Gordon says. “I look for dividend growth that matches the underlying earnings growth of the company.”


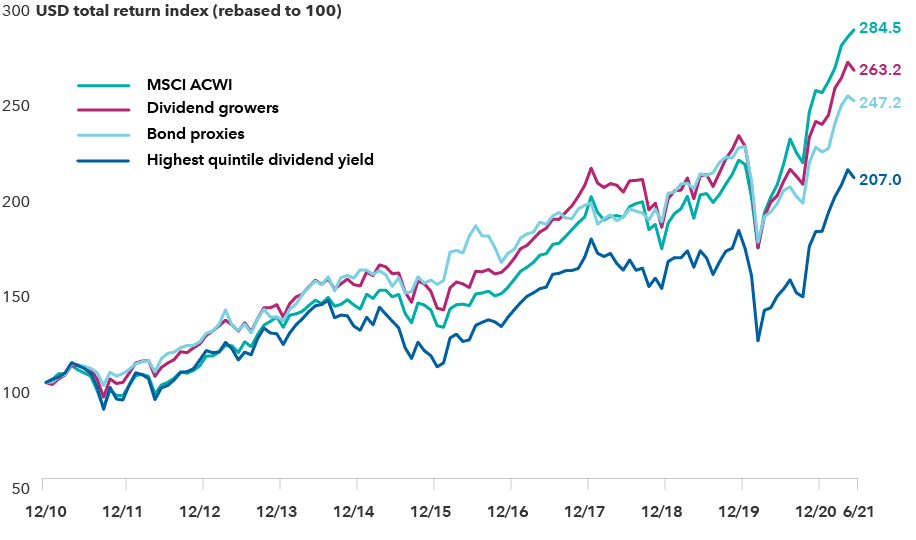
Dividend growers historically have tended to generate greater returns than other dividend strategies, while also keeping up relatively well with the broader market. People assume that growth companies far outpaced dividend paying stocks over the past decade, and that’s true when you look at the highest yielding stocks. But dividend growers did nearly as well as the overall market.

Dividend growers have outpaced other income strategies

The illustration shows cumulative total returns in USD (with gross dividends reinvested) of companies represented in the MSCI ACWI (All Country World Index) segmented by dividend policy for the period December 31, 2010, through June 30, 2021. Returns are as follows: MSCI ACWI, 284.5; dividend growers, 263.2; bond proxies, 247.2; highest quintile dividend yield, 207.0. Highest quintile dividend yield are the top 20% of companies by 12-month forward dividend yield. Bond proxies are those stocks that tend to have higher yields but lower growth. They include stocks in the telecom, utilities and consumer staples sectors as well as REITs, railroads and transportation infrastructure stocks. Dividend growers include stocks with consistent dividend growth over the previous five years. Past results are not predictive of results in future periods. Sources: Jefferies, FactSet Alpha Tester.

Sources: Jefferies, FactSet Alpha Tester. Results are cumulative total returns in USD (with gross dividends reinvested) of companies represented in the MSCI ACWI (All Country World Index) segmented by dividend policy for the period December 31, 2010, through June 30, 2021. Highest quintile dividend yield are the top 20% of companies by 12-month forward dividend yield. Bond proxies are those stocks that tend to have higher yields but lower growth. They include stocks in the telecom, utilities and consumer staples sectors as well as REITs, railroads and transportation infrastructure stocks. Dividend growers include stocks with consistent dividend growth over the previous five years. Past results are not predictive of results in future periods.

In addition to providing a growing stream of income, dividend growth can be a sign of management’s more rigorous capital allocation process. “Because they are committed to setting aside some proportion of their earnings for investors, they tend to have better discipline and may be less likely to make some ill-advised acquisition,” Gordon says.


Because it is reflective of growing earnings, dividend growth can also offer a measure of resilience against interest rate hikes, Gordon adds.

Supersize me: The power of reinvested dividends


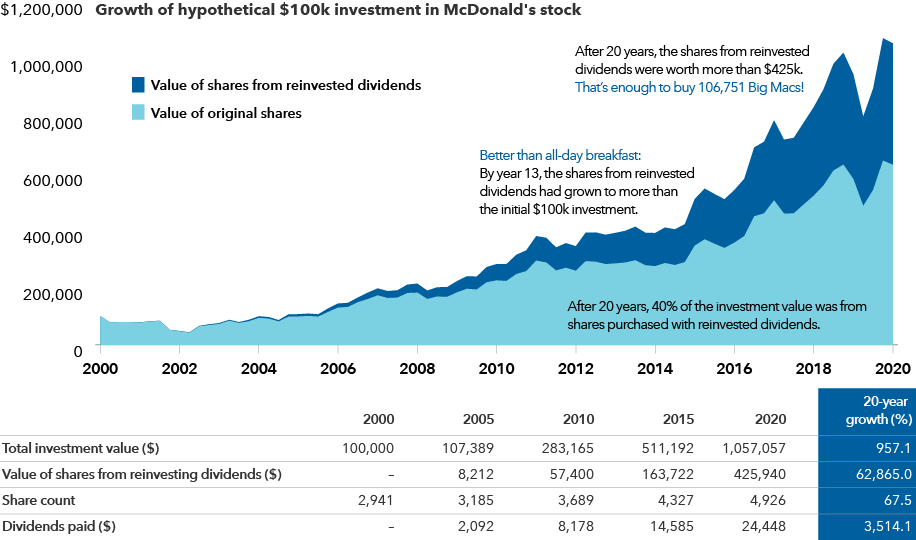
One company that has consistently grown its dividends is McDonald’s. To get a sense of how regularly reinvesting dividend payments can compound over time, consider a hypothetical $100,000 investment in the company for the 20 years from December 31, 2000, through December 31, 2020, with all dividends reinvested.


Big Macs were probably not what Albert Einstein imagined when he called compound interest the “Eighth Wonder of the World.” But the power of compounding can be a wonder to behold.


In this hypothetical example, the total return of the investment would have been impressive — from $100,000 to $1,057,057, a 957% gain.

Reinvested dividends: Better than breakfast all day

The illustration shows the growth of a hypothetical $100,000 investment in McDonald’s stock for the 20 years from December 31, 2000, through December 31, 2020, with all dividends reinvested. Results are in USD. The total ending value of the investment would have been $1,057,057, with 40% of the total coming from dividend payments. A table below the graphic includes various metrics for the growth of a hypothetical $100,000 investment in McDonald’s stock for the 20 years from December 31, 2000, through December 31, 2020, with all dividends reinvested. Results are in USD. The table shows various metrics at the end of five-year intervals. The total value of the investment was as follows: $100,000 in 2000; $107,389 in 2005; $283,165 in 2010; $511,192 in 2015; and $1,057,057 in 2020. The value of shares from reinvested dividends was as follows: $0 in 2000; $8,212 in 2005; $57,400 in 2010; $163,722 in 2015; and $425,940 in 2020. The share count was as follows: 2,941 in 2000; 3,185 in 2005; 3,689 in 2010; 4,327 in 2015; 4,926 in 2020. Dividends paid were as follows: $2,092 in 2005; $8,178 in 2010; $14,585 in 2015; and $24,448 in 2020. Sources: Capital Group, FactSet. This information should not be considered a recommendation to purchase or sell a particular security and is provided for illustrative purposes only.

Sources: Capital Group, FactSet. Growth rate calculations for value of shares from reinvested dividends and dividends paid use the first year's dividends payment ($676) as a starting value. This information should not be considered a recommendation to purchase or sell a particular security and is provided for illustrative purposes only.

Take a look at what happened with the dividends. The value of shares from reinvested dividends would have grown from $676 in 2001 to $425,940 in 2020, or enough to purchase more than 106,000 Big Macs last year.


The special sauce of compounding in this example lies in the growth in share count from reinvested dividends. The number of shares purchased with the original investment would have been 2,941. By the end of the 20 years, the share count would have increased to 4,926, a 67% increase. For the length of the investment, dividend payments would have represented 40% of the total return.

Yield Dogs remain vigilant in the hunt for income


Although the search for dividend paying stocks has expanded and become more challenging since the Yield Dogs took their first investment research trip to Cleveland some three decades ago, Gordon remains energized by the work.


“We had virtual meetings recently with 15 companies,” Gordon says. “We spoke with the CEOs and CFOs to try to get a good sense of management's willingness to recommend raising the dividend to the company’s board of directors.”


And as economies increasingly normalize, Gordon says she is finding a broader set of opportunities that she believes represent compelling value for investors. “I look for companies that are yielding around 2.5% to 3.0%, and that are growing their dividends and earnings around 10% or 12% a year. Today I am finding a number of companies that meet that criteria across a wide range of sectors and global markets.”


That’s how the Yield Dogs continue to make a meal out of dividend investing.

joyce-gordon-color-600x600

Joyce Gordon is an equity portfolio manager at Capital Group with 41 years of investment experience as of 12/31/21. She holds an MBA and a bachelor’s in business finance from the University of Southern California.

Investing outside the United States involves risks, such as currency fluctuations, periods of illiquidity and price volatility, as more fully described in the prospectus. These risks may be heightened in connection with investments in developing countries.


The market index is unmanaged and, therefore, has no expenses. Investors cannot invest directly in an index.


MSCI All Country World Index is a free float-adjusted market capitalization-weighted index that is designed to measure equity market results in the global developed and emerging markets, consisting of more than 40 developed and emerging market country indexes.

Investments are not FDIC-insured, nor are they deposits of or guaranteed by a bank or any other entity, so they may lose value.
Investors should carefully consider investment objectives, risks, charges and expenses. This and other important information is contained in the fund prospectuses and summary prospectuses, which can be obtained from a financial professional and should be read carefully before investing.
Statements attributed to an individual represent the opinions of that individual as of the date published and do not necessarily reflect the opinions of Capital Group or its affiliates. This information is intended to highlight issues and should not be considered advice, an endorsement or a recommendation.
All Capital Group trademarks mentioned are owned by The Capital Group Companies, Inc., an affiliated company or fund. All other company and product names mentioned are the property of their respective companies.
Use of this website is intended for U.S. residents only. Use of this website and materials is also subject to approval by your home office.
Capital Client Group, Inc.
This content, developed by Capital Group, home of American Funds, should not be used as a primary basis for investment decisions and is not intended to serve as impartial investment or fiduciary advice.