OUR CAPITAL GROUP ACTIVE-PASSIVE MODELS
Tailor an active-passive approach for your clients
Whether your client’s objectives are total return, yield, preservation of capital or a combination, Capital Group has an active-passive model designed to help them achieve their goals.
Core
Tax-aware
Retirement
Click HERE to review the historical fund allocations for Capital Group active-passive models.
Measuring portfolio success
We measure success through an objective-based lens. Excess return is not the sole measure of success. In some cases, it may not even be a client's primary concern. We measure our model's success by how well they meet client goals.
Figures shown reflect the past results for the Class F-2 shares of the underlying American Funds and third-party exchange-traded funds as of December 31, 2022 and are not predictive of results in future periods. Current and future results may be lower or higher than those shown. Prices and returns will vary, so investors may lose money. Investing for short periods makes losses more likely. For current information and month-end results, visit capitalgroup.com. Results for non-American Funds are calculated by their respective fund companies via Morningstar. Due to differing calculation methods, the results shown here may differ from those calculated by individual fund companies.
Unless otherwise noted, model results shown reflect changes, if any, in the underlying fund allocations over the model’s lifetime. Underlying funds may have been added or removed during a model’s lifetime. Allocations are rebalanced monthly. Rebalancing approaches may differ depending on where the account is held. Go to capitalgroup.com/advisor/investments/model-portfolios/returns for historical underlying fund allocations.
-
-
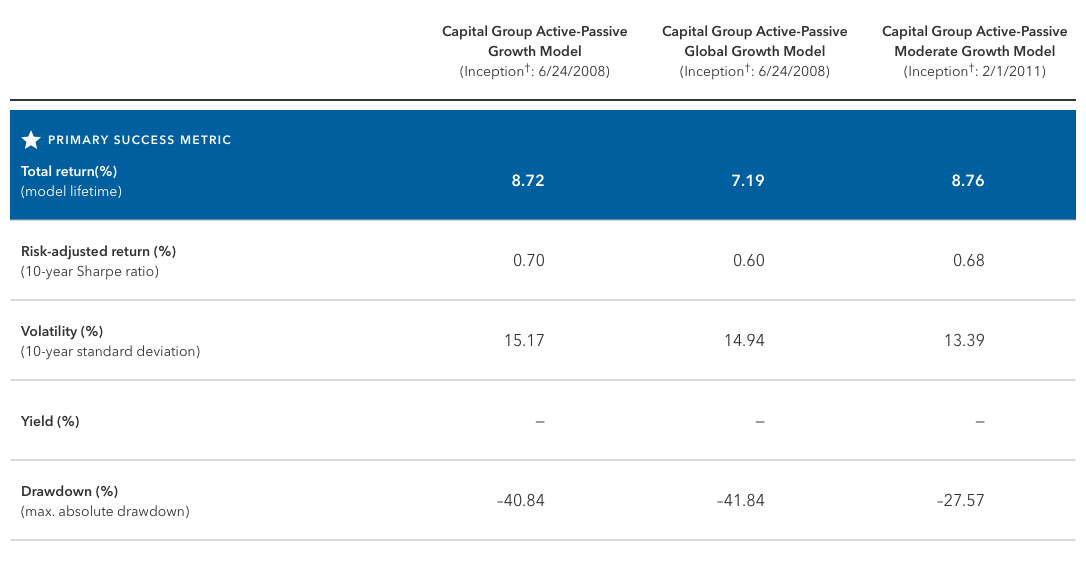
Growth

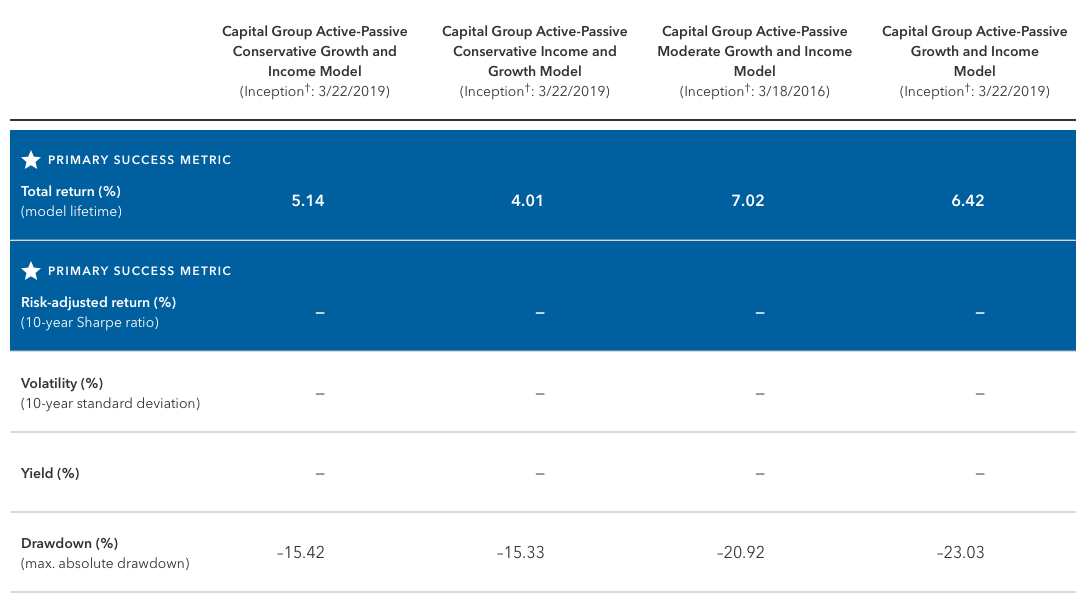
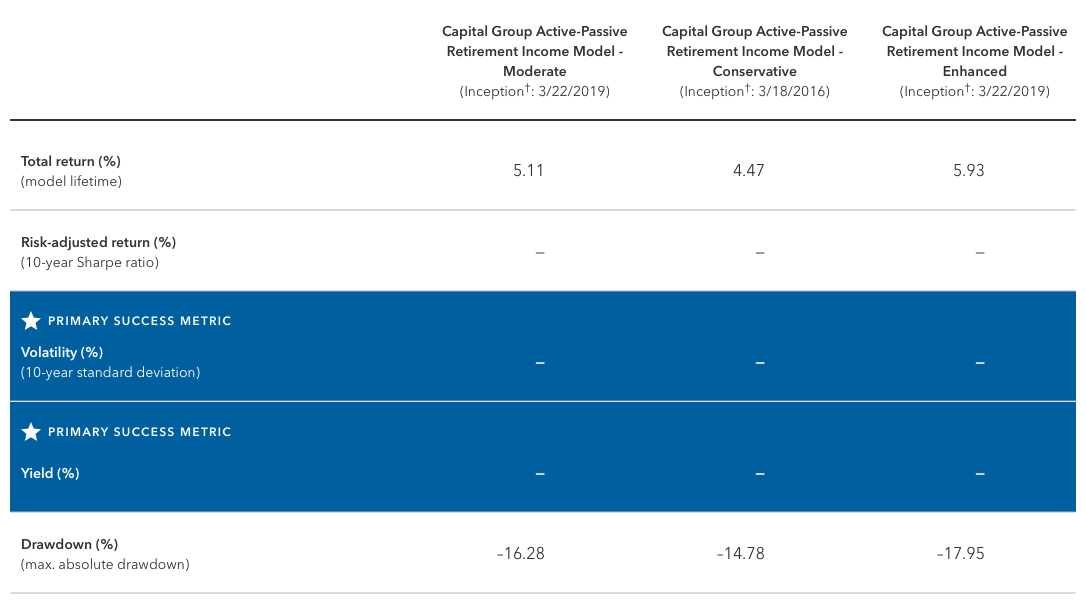
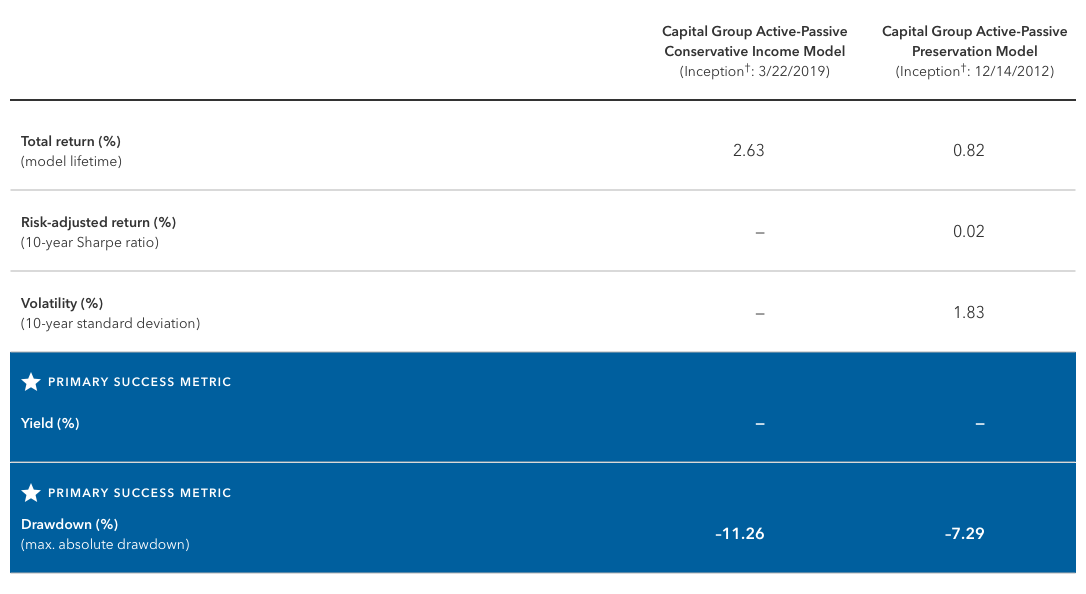
†The inception date of the youngest underlying fund in the portfolio is used as the reference point for calculating lifetime results.
For underlying fund allocations, results, and expense ratios for Capital Group Active-Passive Growth Model click here, for Capital Group Active-Passive Global Growth Model click here, for Capital Group Active-Passive Moderate Growth Model click here.
Results are as of December 31, 2022. Drawdown data as of December 31, 2022. See capitalgroup.com/advisor/investments/model-portfolios.htm for historical underlying fund allocations.
Maximum drawdown is a measure of downside risk over a given time period; it is the maximum loss from the highest point to lowest point of (fund/portfolio) returns before a new high point is reached. Sharpe ratio is calculated by using standard deviation and excess return to determine reward per unit of risk. The higher the Sharpe ratio, the better the portfolio‘s historical risk-adjusted performance. Volatility measured by annualized standard deviation. -
Growth and income
-
Income
-
Preservation and income
-
Stay in the loop with the latest model portfolio news and insights.
Receive quarterly updates on Capital Group Model Portfolios, including commentaries, asset mix changes and other client-facing communication.
†Required
Advisory services offered through Capital Research and Management Company (CRMC) and its RIA affiliates.
Investments are not FDIC-insured, nor are they deposits of or guaranteed by a bank or any other entity, so they may lose value.
Investors should carefully consider investment objectives, risks, charges and expenses. This and other important information is contained in the mutual fund prospectuses and summary prospectuses, which can be obtained from a financial professional, and should be read carefully before investing.
Model portfolios are subject to the risks associated with the underlying funds in the model portfolio. Investors should carefully consider investment objectives, risks, fees and expenses of the funds in the model portfolio, which are contained in the fund prospectuses. Investing outside the United States involves risks, such as currency fluctuations, periods of illiquidity and price volatility. These risks may be heightened in connection with investments in developing countries. Smaller company stocks entail additional risks, and they can fluctuate in price more than larger company stocks. The return of principal for bond funds and for funds with significant underlying bond holdings is not guaranteed. Fund shares are subject to the same interest rate, inflation and credit risks associated with the underlying bond holdings. Lower rated bonds are subject to greater fluctuations in value and risk of loss of income and principal than higher rated bonds. Investments in mortgage-related securities involve additional risks, such as prepayment risk. The use of derivatives involves a variety of risks, which may be different from, or greater than, the risks associated with investing in traditional securities, such as stocks and bonds. A nondiversified fund has the ability to invest a larger percentage of assets in the securities of a smaller number of issuers than a diversified fund. As a result, poor results by a single issuer could adversely affect fund results more than if the fund were invested in a larger number of issuers. See the applicable prospectus for details.
Model portfolios are provided to financial intermediaries who may or may not recommend them to clients. These portfolios consist of an allocation of funds for investors to consider and are not intended to be investment recommendations. The portfolios are asset allocations designed for individuals with different time horizons investment objectives and risk profiles. Allocations may change and may not achieve investment objectives. If a cash allocation is not reflected in a model, the intermediary may choose to add one. Capital Group does not have investment discretion or authority over investment allocations in client accounts. Rebalancing approaches may differ depending on where the account is held. Investors should talk to their financial professional for information on other investment alternatives that may be available. In making investment decisions, investors should consider their other assets, income, and investments. Visit capitalgroup.com for current allocations.
This content, developed by Capital Group, home of American Funds, should not be used as a primary basis for investment decisions and is not intended to serve as impartial investment or fiduciary advice.
All Capital Group trademarks are registered trademarks owned by The Capital Group Companies, Inc. or an affiliated company. All other company and product names mentioned are the trademarks or registered trademarks of their respective companies.
Use of this website is intended for U.S. residents only.


