U.S. EQUITIES

Magnificent Seven: What do you need to believe?

The Magnificent Seven stocks — Alphabet, Amazon, Apple, Meta, Microsoft, Nvidia and Tesla — now sport a market cap of around $12 trillion. Looking further into the market, the sales and profitability of the next $12 trillion in market cap are represented by 42 companies from a broad set of industries ranging from tech and health care to financials and consumer companies.

Can the Magnificent Seven maintain their dominance?
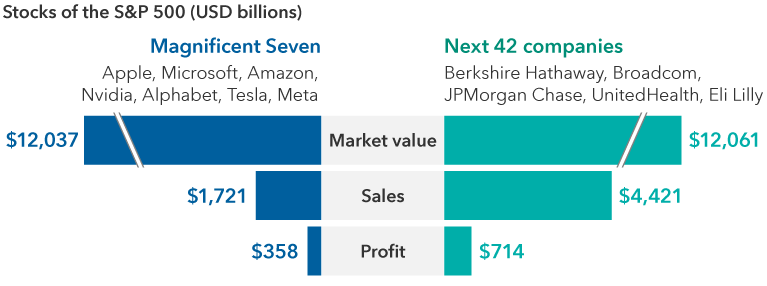
The bar chart shows a comparison of Magnificent Seven stocks — Apple, Microsoft, Amazon, Nvidia, Alphabet, Tesla and Meta. This group is compared to the next 42 companies in the S&P 500 that have an equivalent market cap of the mega-cap tech group. Leaders of this group ranked by market capitalization include Berkshire Hathaway, Broadcom, JPMorgan Chase, UnitedHealth and Eli Lilly. The bar graph compares market value, sales and profit. The market value of the Magnificent Seven is $12.04 trillion compared to the next 42 companies at $12.06 trillion. Sales for the Magnificent Seven are about $1.7 trillion, and the next 42 companies are $4.4 trillion. For profit, the Magnificent Seven boasts about $358 billion versus the next 42 companies at $714 billion.

Sources: Capital Group, LSEG. Next 42 companies represent stocks following the Magnificent Seven, ranked by market capitalization, with the above stocks topping the list. Sales are the net sales (or revenues) of the relevant item reported in the last 12 months. Profit is represented by the trailing 12-month operating profit. As of December 31, 2023.

Both the 12-month forward sales and earnings for this next set of companies making up a $12 trillion market cap are higher than for the Magnificent Seven, according to London Stock Exchange Group (LSEG) data as of December 31, 2023 — yet another data point indicating U.S. stock market performance could broaden in the coming years, pending earnings outlooks. 


Our focus remains on valuations given the rise in share prices for the Magnificent Seven. The S&P 500 Index has a forward price-to-earnings (P/E) ratio of about 15.5x excluding the Magnificent Seven, while the Magnificent Seven has a P/E of about 35x, according to data compiled by FactSet as of January 2, 2024. Earnings growth estimates in 2024 bring the division into high relief — the Magnificent Seven boasts 20.8%, with the S&P 500 at 11.5%, and S&P 500 sans-Magnificent Seven at 6.7%, respectively. For 2025, earnings growth estimates for those three groups are projected at about 17%, 12% and 6.7%, respectively. Longer term earnings estimates for the M7 remain higher, but the uncertainty band around them would also be higher. Hence, the need to diversify. 


There’s a strong case to be made for the companies apart from their stock performance. The Bloomberg Magnificent 7 Total Return Index advanced 107% in 2023 versus the overall S&P 500 Index at 24%, largely because the positive fundamentals more than offset headwinds from rising interest rates. In 2023, these companies implemented stronger cost discipline through headcount reductions and capital reallocation to more profitable projects.

Capital Ideas™ webinars

Insights for long-term success
CE credit available

Sound balance sheets and strong cash generation give the Magnificent Seven an edge to invest in research and development, while also investing in artificial intelligence (AI) to potentially drive growth in the coming years. Last year, these companies in aggregate spent over $170 billion in capital expenditures and over $200 billion on research and development on initiatives that might have a secular impact on the economy, such as AI applications. 


Risks to the group include elevated investor expectations after strong earnings in a choppy economic environment. Additionally, signs of global economic weakness could impact certain big-cap tech stocks more than others. Heightened geopolitical tensions and regulatory questions may also linger throughout 2024. 


Nevertheless, investors may want to consider some exposure to the Magnificent Seven and also a broader set of stocks within the S&P 500 — as well as non-U.S. markets, where in some cases valuations are reasonable and prospects for both top-line and bottom-line growth look promising.

david-polak-color-600x600

David Polak is an investment director with 40 years of investment industry experience (as of 12/31/2023). He holds a bachelor’s degree in economics from University College London graduating with honors.

The Bloomberg Magnificent 7 Total Return Index is an equal-dollar weighted equity benchmark consisting of a fixed basket of 7 widely-traded companies classified in the United States and representing the Communications, Consumer Discretionary and Technology sectors as defined by Bloomberg Industry Classification System (BICS). 


The S&P 500 Index is a market-capitalization-weighted index based on the results of 500 widely held common stocks.


London Stock Exchange Group plc and its group undertakings (collectively, the “LSE Group”). © LSE Group 2024. FTSE Russell is a trading name of certain of the LSE Group companies. FTSE® and Russell® indexes are trademarks of the relevant LSE Group companies and are used by any other LSE Group company under license. All rights in the FTSE Russell indexes or data vest in the relevant LSE Group company which owns the index or the data. Neither LSE Group nor its licensors accept any liability for any errors or omissions in the indexes or data and no party may rely on any indexes or data contained in this communication. No further distribution of data from the LSE Group is permitted without the relevant LSE Group company's express written consent. The LSE Group does not promote, sponsor or endorse the content of this communication.


Bloomberg Index Services Limited. Bloomberg® is a trademark and service mark of Bloomberg Finance L.P. and its affiliates (collectively “Bloomberg”). Bloomberg or Bloomberg’s licensors own all proprietary rights in the Bloomberg Indices. Neither Bloomberg nor Bloomberg’s licensors approves or endorses this material, or guarantees the accuracy or completeness of any information herein, or makes any warranty, express or implied, as to the results to be obtained therefrom and, to the maximum extent allowed by law, neither shall have any liability or responsibility for injury or damages arising in connection therewith.


The S&P 500 Index is a product of S&P Dow Jones Indices LLC and/or its affiliates and has been licensed for use by Capital Group. Copyright © 2024 S&P Dow Jones Indices LLC, a division of S&P Global, and/or its affiliates. All rights reserved. Redistribution or reproduction in whole or in part is prohibited without written permission of S&P Dow Jones Indices LLC.

Investments are not FDIC-insured, nor are they deposits of or guaranteed by a bank or any other entity, so they may lose value.
Investors should carefully consider investment objectives, risks, charges and expenses. This and other important information is contained in the fund prospectuses and summary prospectuses, which can be obtained from a financial professional and should be read carefully before investing.
Statements attributed to an individual represent the opinions of that individual as of the date published and do not necessarily reflect the opinions of Capital Group or its affiliates. This information is intended to highlight issues and should not be considered advice, an endorsement or a recommendation.
All Capital Group trademarks mentioned are owned by The Capital Group Companies, Inc., an affiliated company or fund. All other company and product names mentioned are the property of their respective companies.
Use of this website is intended for U.S. residents only. Use of this website and materials is also subject to approval by your home office.
Capital Client Group, Inc.
This content, developed by Capital Group, home of American Funds, should not be used as a primary basis for investment decisions and is not intended to serve as impartial investment or fiduciary advice.