Chart in Focus
International
You can’t build the new economy without old companies.
Case in point: The mining industry, a long-neglected corner of the equity markets, suddenly looks a lot more attractive. With commodity prices skyrocketing, companies that produce basic materials such as iron ore, copper and nickel are back in favor given the crucial role they play in the global economy.
As digitally focused, e-commerce and social media companies struggle in the market downturn so far this year, investors are refocusing on old-economy, hard hat companies, which make up a larger portion of publicly traded markets outside the United States.
“Investors are starting to embrace companies that produce tangible assets,” says Carl Kawaja, a portfolio manager for EuroPacific Growth Fund®. “For instance, nickel and copper are key components in the production of electric vehicles. We all know how rapidly EVs are growing, but I think people underappreciate the extent to which you still need a lot of nickel and copper to build them.”
Mining vs. Meta
Some commodity prices could remain high for years due to chronic underinvestment in new mining projects and the extended length of time it takes to gain government approval. That dynamic remains largely unrecognized by the market.
For some timely evidence, look at the market capitalization of the world’s five largest mining companies. Combined they barely exceed the value of Facebook parent Meta Platforms.
Mining companies toil in obscurity despite key role in global economy
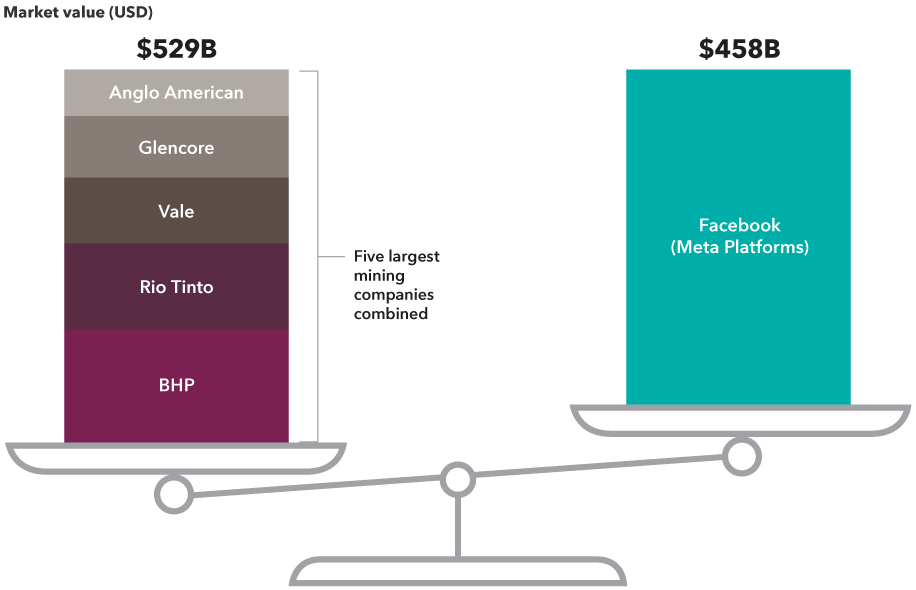
Source: RIMES. As of 5/31/2022. Facebook data is the market value for the entire company, which was renamed Meta Platforms in 2021.
Iron ore, a key ingredient in steel, is another good example.
“I’m not really worried about Silicon Valley disrupting the iron ore industry,” Kawaja says. “It’s been around since the Iron Age. That’s an enduring business.”
So far this year, the metals and mining sector of the MSCI All Country World ex USA Index is up 7.8%. That compares to a 12.8% decline for the overall index, as of May 31.
ESG is everywhere
Another area where international markets excel is ESG, or environmental, social and governance investing. Pioneered in Europe, ESG is everywhere today and it’s only going to get more important in the years ahead.
The global push to reduce carbon emissions and improve energy efficiency is often associated with electric vehicles or solar and wind power. But the effort extends beyond the auto and energy sectors.
Buildings release more carbon dioxide into the atmosphere than the entire transport industry. So companies such as Carrier and Daikin are developing heating and air conditioning systems that could drastically reduce greenhouse gas emissions. Regulations in Europe and elsewhere that require the replacement of older systems with more energy-efficient products could drive long-term opportunities for both companies.
Smart industrials are making buildings more sustainable

Sources: Capital Group, company reports, Refinitiv Datastream. Company market cap is in USD as of 4/30/22.
Tighter regulations and greater infrastructure spending could also provide tailwinds for construction materials supplier Sika. The Swiss company makes cement additives that can reduce emissions and increase durability.
“This may sound like a boring business,” says Jonathan Knowles, a portfolio manager for New Perspective Fund®, “but its growth potential is pretty compelling as global emissions standards tighten.”
European economy growing despite headwinds
Overall, the outlook for international equity markets remains cloudy given high inflation, rising interest rates and the war in Ukraine. However, the prevalence of old-economy, dividend-paying companies in Europe — exactly the type that are back in favor — could mean that international markets are poised for a period of relative outperformance.
The European economy is holding up remarkably well despite investor worries about a war-induced recession. While the manufacturing sector has been hurt by the war in Ukraine and fears that Russia may cut off natural gas supplies, the services sector has done much better, driven primarily by pent-up demand.
“There's still a reasonable degree of momentum in the European economy,” says economist Robert Lind. “That's a reflection of the reopening trends we saw at the start of the year as governments began easing pandemic-related restrictions.”
Services sector bolsters eurozone economy as manufacturing slows
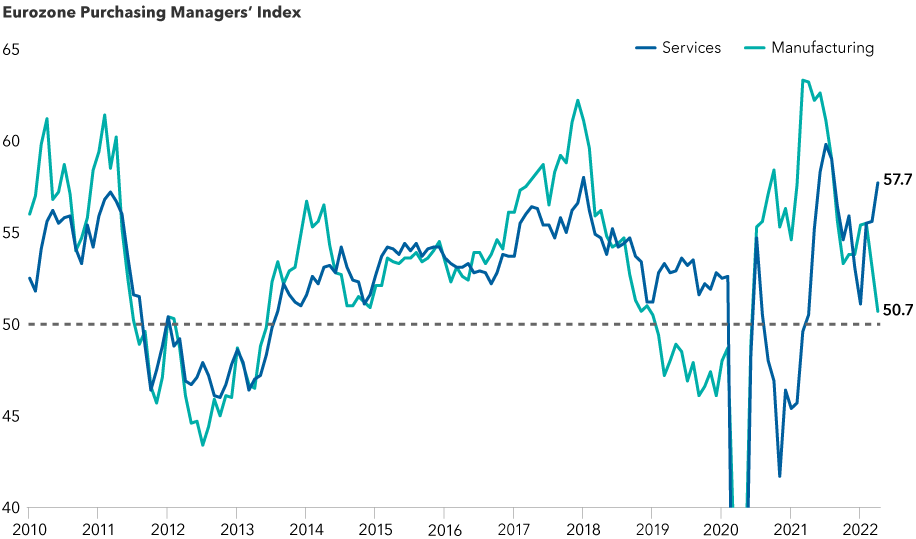
Sources: Haver, S&P Global. As of April 2022. The Eurozone Purchasing Managers' Index (PMI) is a measure of business activity compared to the previous month, based on a survey of around 5,000 companies based in the euro area manufacturing and service sectors. PMI levels above 50 indicate growth and levels below 50 indicate contraction. In 2020, the Services PMI declined to 12.0 and the Manufacturing PMI declined to 18.1, but are not shown on the chart for scale.
The services sector — which includes finance, retail and tourism among others — accounts for the bulk of employment and economic output in the eurozone, Lind notes. If current trends persist, that means Europe could continue growing despite weakness in the manufacturing sector.
Lind expects GDP growth in the eurozone to come in around 2.5% to 3.0% this year. That would represent a strong expansion relative to the eurozone’s average GDP growth rate of roughly 1.0% over the past decade.
Solid economic growth coupled with high inflation means the European Central Bank is likely to begin raising interest rates in July, Lind says. That should provide some relief to the European banking sector, which has suffered under negative rates since 2014. The ECB’s key policy rate now stands at –0.50%. Just two hikes of 25 basis points would effectively end the era of negative policy rates in Europe — a major milestone.
Keep an eye on value stocks
A sustained shift toward value-oriented stocks could provide a boost to European markets, given the greater representation of such stocks in the major European indexes. Europe, and emerging markets for that matter, also have a much greater number of dividend-paying stocks compared to the U.S., as well as higher average dividend yields.
It’s too early to tell if value stocks will continue to outpace growth stocks for the full year. Although both categories are in negative territory, on a relative basis, value is the undisputed winner so far.
Value stocks are running well ahead of growth stocks this year
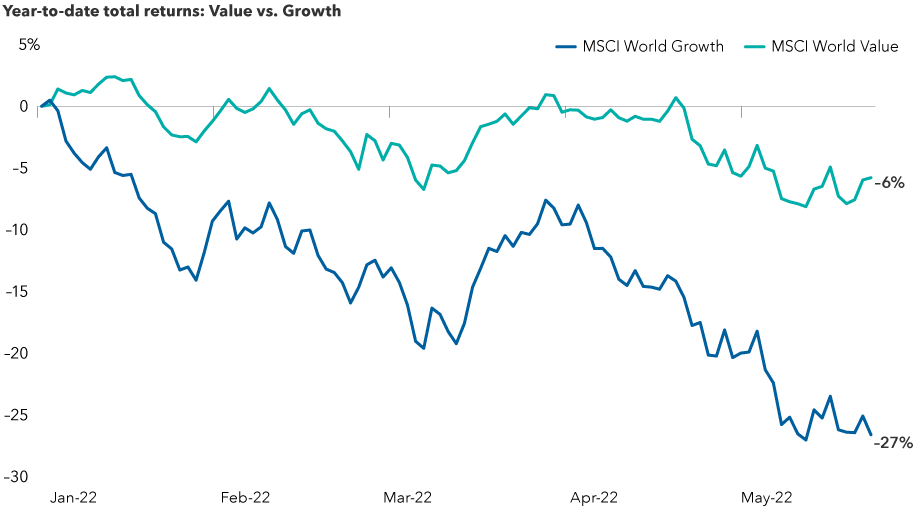
Sources: Capital Group, MSCI, Refinitive Datastream. Returns reflect cumulative total returns from December 31, 2021, through May 24, 2022.
“After many years of subpar results, we are starting to see a better showing from more value-driven investments,” says Steve Watson, a portfolio manager for International Growth and Income FundSM.
"In my view we are heading into an equity market that will be less obsessed with growth and more cognizant of value. Despite the challenges facing Europe, I believe there is real value appearing in European shares. As a contrarian, value-oriented investor, I like to think that will continue."
Value-oriented sectors play a large role in non-U.S. markets
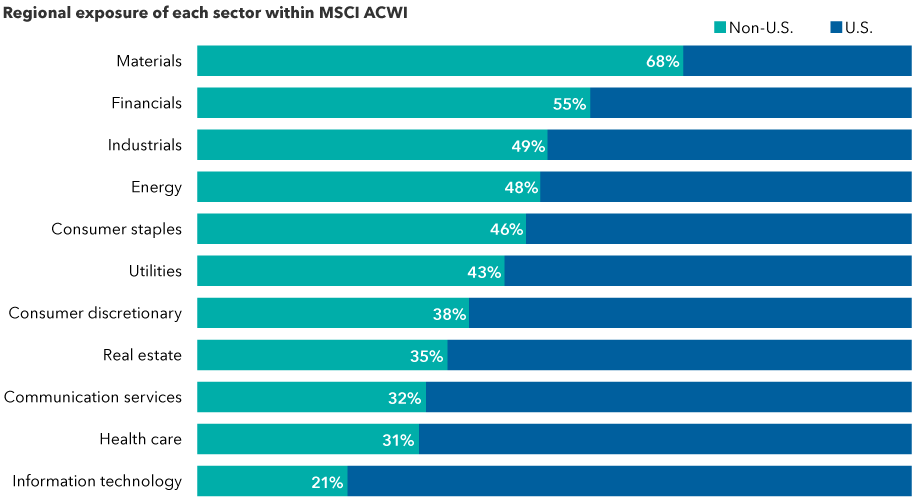
Sources: MSCI, RIMES. As of 4/30/2022.
The primary source of uncertainty, of course, remains the war in Ukraine and the worry that it may spread into other European countries. While the outcome is unpredictable and the risk of escalation is ever-present, Europe’s unified response to Russia’s February 24 invasion has been encouraging, Watson says.
“Many of us who observe the international scene were surprised at how quickly Europe rose to the challenge,” Watson explains. “Germany, for example, making a commitment to spend at least 2% of its GDP on defense — that was considered nearly impossible just a few months ago.”
Unprecedented sanctions imposed by the European Union and the United States have also made it clear that Russia’s aggression comes at a high cost.
“The world will recover from this crisis,” Watson reassures. “But how long will it take? That’s a tough call right now.”
Investing outside the United States involves risks, such as currency fluctuations, periods of illiquidity and price volatility. These risks may be heightened in connection with investments in developing countries.
Eurozone Purchasing Managers’ Index (PMI) is a measure of business activity compared to the previous month, based on a survey of around 5,000 companies based in the euro area manufacturing and service sectors.
MSCI All Country World Index is a free float-adjusted, market capitalization-weighted index designed to measure equity market results in more than 40 developed and emerging market countries.
MSCI All Country World ex USA Index is a free float-adjusted, market capitalization-weighted index designed to measure equity market results in developed and emerging markets, excluding the United States. The index consists of more than 40 developed and emerging market countries.
MSCI World Growth Index is designed to measure the returns of large- and mid-cap global equities exhibiting overall growth style characteristics across 23 developed countries.
MSCI World Value Index is designed to measure the returns of large- and mid-cap global equities exhibiting overall value style characteristics across 23 developed countries.
The market indexes are unmanaged and, therefore, have no expenses. Investors cannot invest directly in an index.
MSCI has not approved, reviewed or produced this report, makes no express or implied warranties or representations and is not liable whatsoever for any data in the report. You may not redistribute the MSCI data or use it as a basis for other indices or investment products.
 Carl Kawaja
 Robert Lind
 Steve Watson