
Risk
What L.A. wildfire victims need to know about taxes and other financial matters
Even the most dedicated resolution-maker could learn a thing or two from the indefatigable U.S. economy. The combination of moderating inflation, swelling productivity and ever-dauntless consumer spending keyed a second straight year of luminous equity returns. And the immediate outlook appears favorable, with forecasts of robust GDP and corporate earnings complemented by expectations of supportive government policy from the Trump administration.
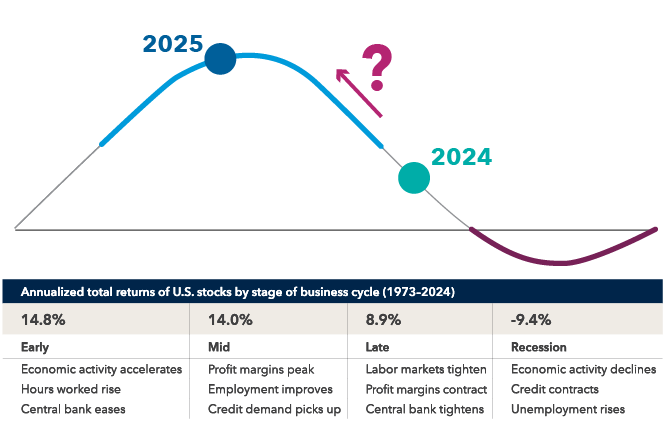
The optimism differs markedly from a year ago, when investors feared a recession as the Federal Reserve hiked interest rates to squash inflation. However, the downturn never came; in fact, 2024 felt like the financial version of the 2008 movie The Curious Case of Benjamin Button. Just as Brad Pitt’s titular character aged in reverse, the U.S. economic clock seemed to wind back to a more youthful point in the business cycle.
Instead of progressing sequentially through the four stages that have traditionally defined post-WWII economy, the U.S. appears to be shifting from late cycle — often an antecedent to a recession — to midcycle, which has been marked by rising profit margins, improving employment and growing credit demand. Historically, markets have fared well during these periods.
On the flip side, there’s no shortage of potential pitfalls, starting with the fact that an economy backtracking to a more salubrious time — not to mention, back-to-back 20%-plus returns in the Standard & Poor’s 500 — are not the norm. Consecutive market gains of that magnitude have occurred only three times in the past 50 years, and not since the late 1990s.
Signs of weakness are emerging in lower-income consumers. And the rest of the world doesn’t have the same vim as the U.S., with anemic annual growth threatened by the prospect of new tariffs.
Nevertheless, keep in mind that forecasters in recent years have consistently underestimated the dynamism of the U.S. economy.
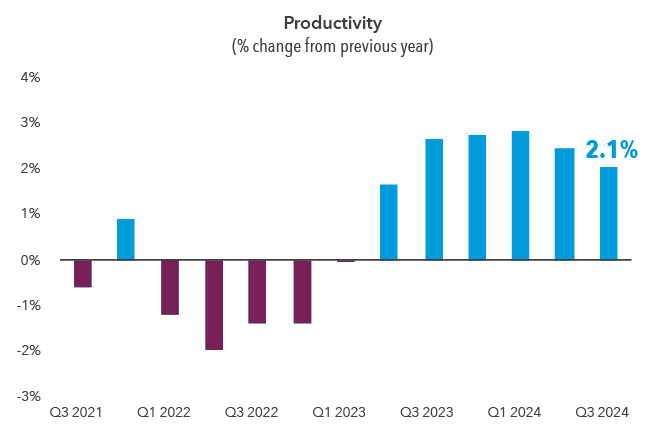
The labor market has returned to historical normalcy following unusually tight conditions after the pandemic. Though beefy growth and a taut labor market might normally spell the return of inflation, some factors could check price growth. Most notably, productivity — a measure of worker efficiency that has been rising steadily for the better part of two years — can allow companies to boost salaries without raising prices. Looking forward, potential tax cuts, deregulation and corporate reshoring are likely to stoke growth. Globally, corporate earnings are expected to strengthen across the developed world.
Some of the bigger questions this year revolve around the paths of inflation, interest rates and bond yields — and the impact of Trump administration policies.
One of the bigger changes in 2024 was the more-accommodative Fed. The central bank cut rates three times, to a target of 4.5%, reversing some of the aggressive run-up the year before. The market anticipates the rate-cutting cycle continuing. But many Capital Group economists believe rates will stay higher for longer than the consensus predicts.
One reason for caution is the post-pandemic trend toward deglobalization. Reshoring and other attempts to localize production can boost the resilience of supply chains, but often at the cost of higher prices.
Additionally, key Trump administration policies carry the specter of inflation. Tariffs directly add to costs, for instance, while restrictions on immigration could crimp a source of less-expensive labor. Pro-growth policies such as tax cuts and deregulation can add to the pressures.
As for the stock market, the technology-heavy information technology and communication services sectors again led the S&P 500 for the year, though they weren’t the sole contributors to returns. The financial sector, which has a much smaller AI footprint, was the third-biggest contributor to the index, edging out the consumer discretionary sector that includes Amazon and Tesla. And while few sectors could match the blistering rate of the overall market, all but materials advanced — a healthier mix than the lopsided results of 2023.
Still, concentration continues to be an issue. While net income growth between the top five companies in the S&P 500 and the rest of the index narrowed, it still favored that familiar bunch of Alphabet, Amazon.com, Apple, Microsoft and Nvidia. In fact, concentration continued to hover well above historical averages, with those five companies comprising 29% of the index by year’s end.
U.S. stock valuations remain high — primarily tech stocks, which are at historically rich levels. However, there are pockets of opportunity outside of tech, including in U.S. small cap, international and emerging markets, all of which trade below their 10-year average price/earnings ratios. Global equities trade at 19 times forward earnings; going back to 1985, stocks in such periods rose a modest 7.4% annually over the next decade. On this basis, U.S. tech stocks wouldn’t be expected to fare particularly well, while international and emerging markets could be positioned to excel.
U.S. Treasuries and taxable bonds delivered slightly positive results for the year, despite a fourth-quarter jump in bond yields as investors recoiled at the likelihood of fewer Fed rate cuts. The yield on the benchmark 10-year Treasury climbed through much of December — nearing its highest levels of recent years — as solid economic data coaxed the Fed to reduce the projected number of rate cuts from four to two.
Investors have spent much of the past few months trying to decode the potential impact of Trump’s economic agenda. Despite central bank rate cuts, the bond market has been preoccupied by fear of stiffer tariffs, widespread deportations, lower taxes and softer regulations — all of which can put upward pressure on inflation and interest rates.
The good news for investors is that, at current yields, fixed income is priced quite attractively. Though equities are expected to deliver a higher absolute return than bonds over the long term, bonds are more attractive than usual right now, underlining their place in well-balanced portfolios.