Tax & Estate Planning
Economic Indicators
“The only sure thing is change,” as the old saw goes, but the third quarter of this year showcased just how sweeping and sometimes unexpected such shifts can be. Highfliers plateaued, the broader market leaped ahead and the presidential election continued to do its level best to resist predictability.
The Federal Reserve also went big — when it cut rates for the first time in four years at its September meeting, the central bank chose to go with a half-point reduction rather than a more-cautious quarter-point trim.
And while the lower interest rates helped boost markets, they’ve also stoked fears of a recession. After all, falling rates have historically often preceded an economic downturn. Yet, there’s reason to take heart — many signs suggest that, rather than move to the “recession” part of the business cycle, we’re instead moving backward, to the portion that emphasizes business expansion. This surprising change is so striking that, as Capital Group economist Jared Franz put it, the U.S. might be experiencing a “Benjamin Button” economy — one in which the normal passage of aging seems to be moving in reverse.
For Franz, the chief indicator to examine is what’s called the “unemployment rate gap” — the difference between actual unemployment and what economists call the natural rate of unemployment. The gap measures the difference between what the economy can sustain and what it’s actually doing. When the actual rate is lower, the economy is likely running hot and inflation is probably building.
While the actual rate of unemployment has ticked up slightly in recent months, to 4.1% in September, it’s still below the natural rate. In other words, today’s labor market remains tight despite recent softness, helping keep things running along at a decent clip. Slowing inflation and positive projections for U.S. GDP and corporate earnings growth further suggest that the risk of a recession in the near term might be unintuitively low.
For equity markets, the quarter’s big shift was in leadership. While the so-called Magnificent Seven dominated returns in 2023 and the first half of 2024, they lagged in the third quarter. International equities grew more than U.S. stocks; similarly, small-cap beat large-cap and dividend-payers beat non-payers. This could be the first step toward unwinding historically high market concentration: Previous periods of mega-cap dominance have been followed by two to six years of stronger returns by the broader market.
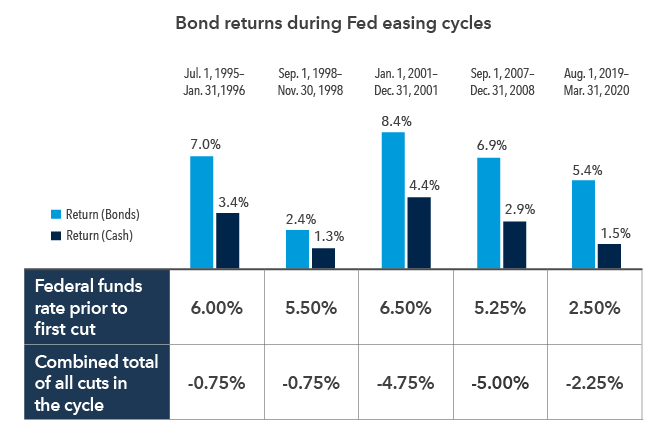
The beginning of a rate-cut cycle has historically favored bonds.
Money-market funds have been major beneficiaries of higher interest rates. Indeed, record levels of cash have flowed into these investments over the last few years. However, as the Fed cuts interest rates — thus lowering the yields on these investments — it’s likely that some amount of the $6 trillion
in these funds will begin to seek yield elsewhere.
Core bonds may be the natural receptacle for any outflows. Indeed, investment-grade bonds have historically done well on a total return basis during cutting cycles, often outpacing cash by a factor of two.
Bonds have outpaced cash during rate-cutting cycles

Sources: Morningstar Direct, Bloomberg, Refinitiv, Federal Reserve. Bond returns represented by Bloomberg U.S. Aggregate Bond Index and cash is represented by Bloomberg U.S. Treasury bills. Periods less than one year reflect the cumulative return for that period; longer periods reflect annualized returns for the period. Indexes are unmanaged and, therefore, have no expenses. Investors cannot invest directly in an index. Past results are not predictive of results in future periods. As of September 30, 2024.
The election could still shake things up, at least in the short term.
The U.S. election season has felt particularly tumultuous, as underlined by a major-party candidate stepping down. Adding to the sense of volatility are the candidates‘ starkly contrasting politics, with their proposals often feeling miles apart.
Perhaps most meaningfully for high net worth investors, tax policy will almost certainly see a major shake-up in the next year or two. Many provisions of the 2017 Tax Cuts and Jobs Act (TCJA) are set to expire at the start of 2026, reverting to previous law. That generally will mean higher income taxes across the board and significantly higher estate taxes for people with estates larger than $7 million. Democratic presidential candidate Vice President Kamala Harris has suggested she would extend the tax cuts for individuals earning $400,000 or less while increasing taxes on the very wealthy and corporations. Former President Donald Trump has said he’d renew the TCJA provisions and has proposed a variety of other tax cuts, including ones that would benefit companies that manufacture products in the U.S.
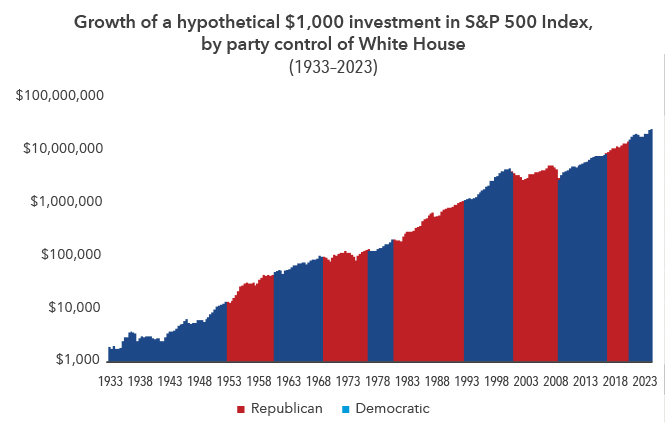
Historically, markets have risen over time in both Democratic and Republican administrations

Sources: Capital Group, RIMES, Standard & Poor‘s. Chart shows the growth of a hypothetical $1,000 investment made on March 4, 1933 (the date of Franklin D. Roosevelt‘s first inauguration) through September 30, 2024. Dates of party control are based on White House inauguration dates. Values are based on total returns in USD. Chart is shown in logarithmic scale. Investors cannot invest directly in an index. Past results are not predictive of results in future periods.
Both parties have pledged to follow through on markedly different platforms that could have near-term impacts on markets. Republicans seek to further reduce regulations, amplify defense spending and increase tariffs, which may benefit banks, oil and gas producers and defense companies. Democrats are focused on tightening regulations, expanding broadband, reforming immigration and continuing to support green energy projects, potentially benefiting renewable energy, telecommunications and industrials.
No matter what the composition of the government looks like for the next few years, investors should take note that markets have, over time, generally not cared who held office. Indeed, in 10-year periods starting with a presidential election year, the S&P 500 has historically grown on average more than 11% annually, regardless of the president’s party affiliation.
Related Insights
Related Insights
-
-
Philanthropy
-
Wealth Planning
