Energy
Is there more fuel in the tank for energy stocks?
That’s the question on many investors’ minds after the energy sector solidly outpaced all others over the past two years. Historically, the trajectory of oil prices has been a good rule of thumb to gauge the prospects of the sector as the price of the commodity directly impacts many companies’ bottom lines. But last year some cracks appeared in this tried-and-true correlation. In fact, oil prices were on a wild ride throughout 2022 with end-of-year prices near where they started. In contrast, energy stocks continued to hold on to much of the gains.
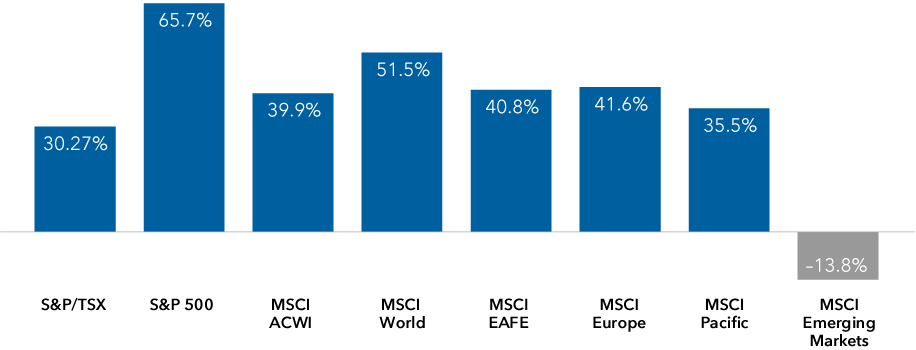
What’s more, the gains were not confined to North America or Europe. The energy sector did, in fact, lead all sectors, across all regions around the world except emerging markets.
Energy surge
One-year global energy sector returns as of December 31, 2022 (local currency)
Source: Capital Group.
Can the up cycle continue?
“I believe we’re in the early stages of a multi-year bull run for oil,” says energy analyst Craig Beacock, who recently returned from Saudi Arabia and Dubai to meet with energy companies and government officials.
Energy bull markets have displayed staying power
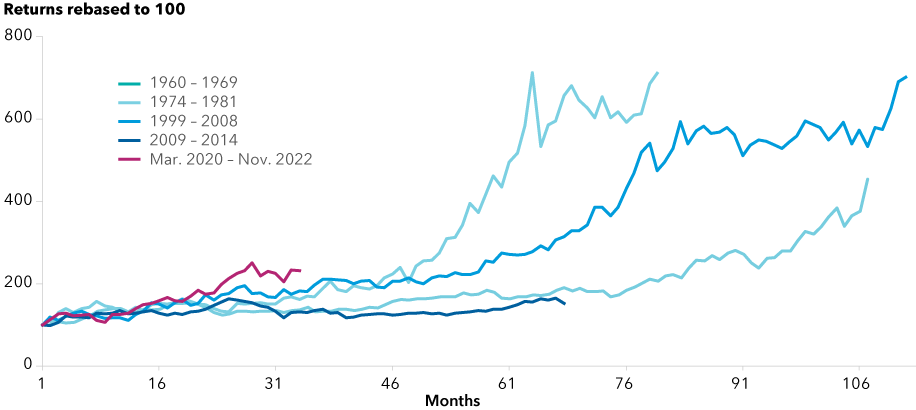
Energy sector performance through prior upcycles
Source: Bloomberg, Peters & Co. Limited.
The chart above highlights four previous energy up cycles, which have historically lasted many years, with the current, potential one starting in March 2020.
That does not mean the energy sector — led by oil stocks — will move up in a straight line. Beacock anticipates periods when the energy sector loses steam and heads downward or simply moves sideways.
“Amid long, uptrends there are also mini-cycles — some lasting monthss or even or a year or more — when short-term supply/demand trends outweigh longer-term supply/demand trends,” he says. An example of a short-term supply/demand trend may be upon us, he continues, if the U.S. and/or global economy enters recession in 2023. There are other uncertainties as well: a price cap on Russian oil imposed by Western countries and energy windfall taxes imposed by the U.K. and other European countries. The European Union is the latest to tax oil groups with a new levy taking effect December 31 of last year although it’s being challenged in court. Depending on the outcomes of these uncertainties, Beacock says the global energy sector, or certain companies within it, may be challenged in the short term.
Long time horizons
Nevertheless, he sees ample opportunity in the sector for investors with long time horizons of three-to-five years. Beacock’s bullishness stems from a range of factors but the war in Ukraine is not one of them. Evidence of a lack of impact stemming from the war can be found in two places. The first is the price of oil, which roughly sits where it started prior to Russia’s invasion, and the second is the uninterrupted flow of oil out of the country.
“Russian oil supply has not changed materially since Ukraine was invaded,” he says.
What has changed is more structural in nature. Structural in the sense that global spare capacity has not increased to the degree required to meet future needs. That will, anticipates Beacock, impact oil supply in the coming years as illustrated by widening OPEC+ production deficits and dwindling forecasted global spare capacity. Of the major producing oil countries, Beacock estimates Saudi Arabia could increase capacity by a million barrels per day and the United Arab Emirates by another million barrels a day. But it would take years to build-out the capacity and U.S. production is slowing quite quickly. Taken together, there’s just not that much oil to bolster global supply in the days ahead.
Shortfall between production and OPEC+ targets have grown
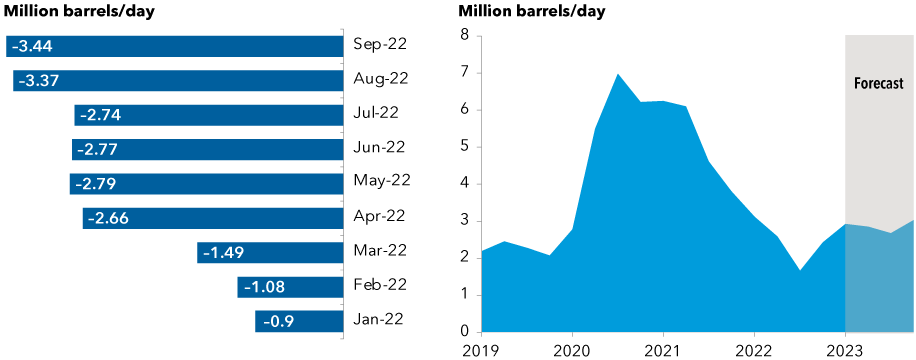
The left chart shows widening gaps between OPEC+ targets and production rates. Source: International Energy Authority. Data as of September 2022. The right chart shows dwindling global spare capacity. Source: U.S. Energy Administration, Refinitiv. Data as of November 2022.
One of the root causes is the fall off in re-investment and total industry capital expenditures over the last 10 years. During the last upcycle (1999-2009) there was a tremendous amount of spending on exploration, site development and ultimately new production. These investments were not, however, rewarded in the marketplace primarily due to the advent of fracking south of the border. The new technology quickly stabilized the supply/demand imbalance through much of the last decade.
“There was a tremendous amount of capital destruction last time around, so investors are pressing companies to return this money to them via increased dividends and share buybacks rather than funding new capital expenditures (capex),” says Beacock. Total industry capex used to be measured at about a trillion U.S. dollars annually. “Now we’re down to about US$350 to US$400 billion.
ESG pressures
In addition to the lack of new capex, environmental, social and governance factors have also played a role. There is, according to Beacock, pressure to invest less in fossil fuel businesses and more in lower carbon energy sources. The movement is particularly strong in Europe versus Canada and the U.S., which may or may not prove to be an advantage for overseas companies in the years to come.
European supermajors investing more capital into low carbon
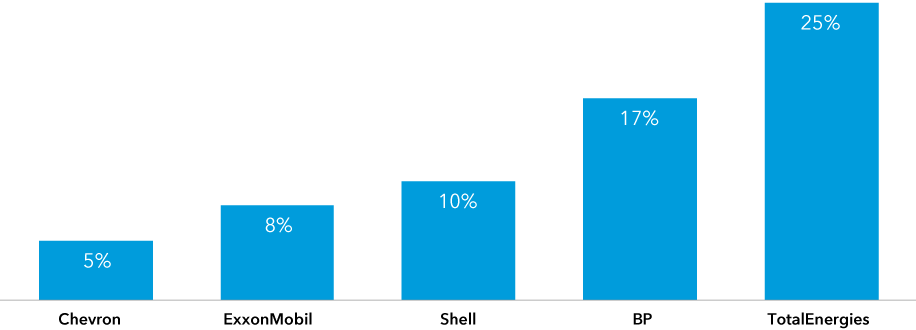
Source: InfluenceMap. Percentage of projected "Low Carbon" investments in 2022 CAPEX per company.
ESG aside, oil consumption remains below pre-COVID levels primarily due to the still recovering international travel sector and the unwinding of lockdown effects in China, which closed the country for almost three years. In fact, S&P estimates Chinese energy demand will grow 3.3 million barrels of oil equivalent per day upon full opening after virtually no growth in 2022. The road back to China’s previous consumption levels may, however, be bumpy as infections and hospitalizations are on rise as the country dismantles its zero-COVID policy. Nevertheless, it stands to reason that when both China and travel return to historical rates of consumption, oil markets may further tighten.
Higher oil prices are not expected to have much of an impact on capacity either as demonstrated in the inelasticity of supply to price, certainly over more recent periods. Oil supply is, in other words, unlikely to dramatically increase even at high prices, which is illustrated in the cost-curves below. Longer, flatter lines show little economic profit for producers while short, steep cost curves enable producers to generate higher profits.
The shorter, steeper cost curve will continue to benefit producers
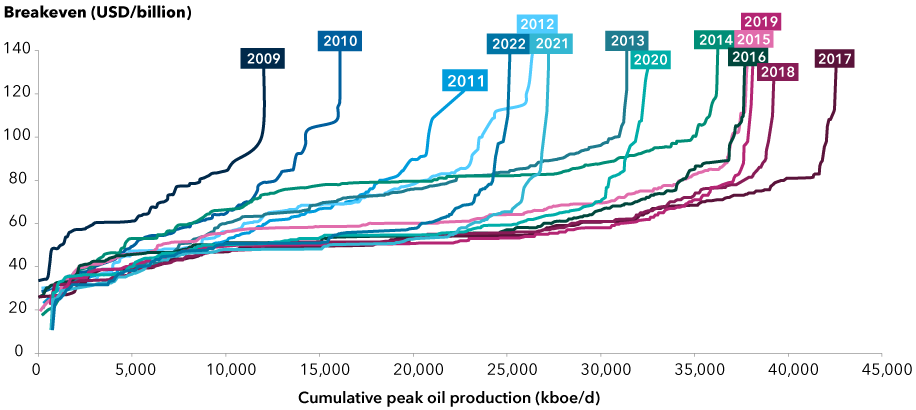
Sources: Capital Group, Bloomberg, Goldman Sachs. Data as of April 2022. kboe/d = thousand barrels of oil equivalent per day. Short and steep cost curves generally enable producers to generate higher profits.
Low sector valuations
Demand/supply dynamics aside, there are other fundamental reasons to be optimistic on oil says Beacock. He cites historically low, single-digit valuations in the energy companies themselves and their relatively small weight on global benchmarks such as the S&P 500. From a high of about 18% of the S&P 500 market cap during the last upcycle to a low of about 2% when oil fell to near zero a barrel, the current weight has rebounded to approximately 5%.
Energy weight in the S&P 500 remains near multi-decade lows
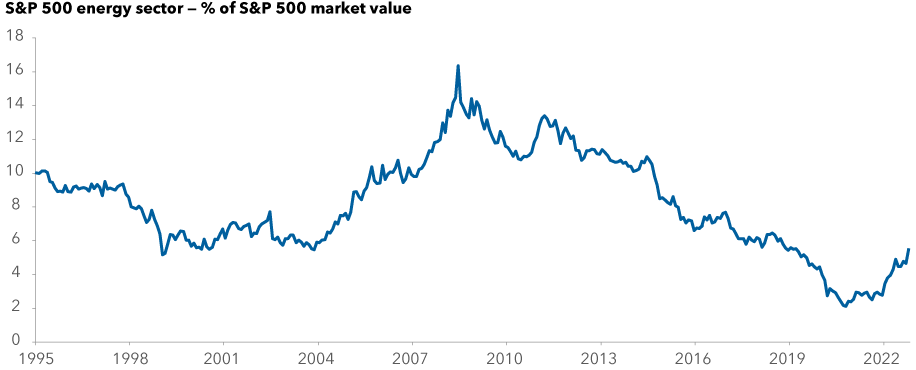
Source: Capital Group, Standard & Poor’s. As of October 2022.
Opportunities
Against this backdrop, Beacock has favourable outlooks on select energy companies around the world with various Canadian oil producers ranking high. Fundamentally, he sees attractive valuations, strong balance sheets, record free cash flow and a focus on shareholder returns. Canadian oil producers are also largely insulated from Russian oil price caps and/or windfall taxes which removes two uncertainties, he adds. Regarding the oil sands themselves, Beacock says they’re long duration assets with low depletion rates that can continue to produce for decades unlike many shale companies that have much shorter reserve lives and face depletion challenges.
He’s also positive on some energy companies south of the border where there’s a larger investment eco-system. In general, U.S. companies would include oil and natural gas producers. There may also be opportunities in equipment and service suppliers to the energy complex in both traditional “picks and shovels” companies and others supporting energy transition. Energy transition is clearly underway, accelerated most recently by the U.S. Inflation Reduction Act of 2022. The act is designed to help drive clean energy transition through incentivizing private investment and has allocated US$369 billion in clean energy spending according to U.S. Congress figures. As this transition takes shape, investment opportunities may be found in both traditional energy sources (for example to support base load electricity production) as well as in the build out of renewables.
In Europe, the short-term outlook is somewhat murkier due to outside forces (price caps and windfall taxes), but the EU is also making substantial investments in energy transition with an estimated 210 billion euros earmarked for clean energy. Also noteworthy is the EU’s commitment to end its dependence on Russian fossil fuels by 2030, which points to the growing potential of European oil supermajors due to energy security.
Investment implications
Amid the fluid geopolitical and economic environment, an active approach relying on deeply researched, company-by-company analysis may serve investors well.
“Global energy investing is not nearly as straightforward or simple as it used to be,” says investment specialist Kathrin Forrest. An investment mandate that has the flexibility to invest globally and look at implications across related sectors and industries may be advantageous, she says. It not only enables portfolio managers to take advantage of opportunities around the world but also adds greater diversification benefits to an overall portfolio.
“There are also investment opportunities in companies related to energy that may be overlooked in sector-specific investment vehicles,” she says.
As of December 31, 2022, the energy sector was well-represented in select Capital Group Canada mandates. At year-end 2022 energy holdings were the second-largest weight in Capital Group Canadian Focused Equity FundTM (Canada) and the sixth in Capital Group Global Equity FundTM (Canada).
Get the 2023 Outlook report
Our latest insights
-
-
Market Volatility
-
-
-
U.S. Equities
Commissions, trailing commissions, management fees and expenses all may be associated with investments in investment funds. Please read the prospectus before investing. Investment funds are not guaranteed or covered by the Canada Deposit Insurance Corporation or by any other government deposit insurer. For investment funds other than money market funds, their values change frequently. For money market funds, there can be no assurances that the fund will be able to maintain its net asset value per security at a constant amount or that the full amount of your investment in the fund will be returned to you. Past performance may not be repeated.
Unless otherwise indicated, the investment professionals featured do not manage Capital Group‘s Canadian investment funds.
References to particular companies or securities, if any, are included for informational or illustrative purposes only and should not be considered as an endorsement by Capital Group. Views expressed regarding a particular company, security, industry or market sector should not be considered an indication of trading intent of any investment funds or current holdings of any investment funds. These views should not be considered as investment advice nor should they be considered a recommendation to buy or sell.
Statements attributed to an individual represent the opinions of that individual as of the date published and do not necessarily reflect the opinions of Capital Group or its affiliates. This information is intended to highlight issues and not be comprehensive or to provide advice. For informational purposes only; not intended to provide tax, legal or financial advice. Capital Group funds are available in Canada through registered dealers. For more information, please consult your financial and tax advisors for your individual situation.
Forward-looking statements are not guarantees of future performance, and actual events and results could differ materially from those expressed or implied in any forward-looking statements made herein. We encourage you to consider these and other factors carefully before making any investment decisions and we urge you to avoid placing undue reliance on forward-looking statements.
The S&P 500 Composite Index (“Index”) is a product of S&P Dow Jones Indices LLC and/or its affiliates and has been licensed for use by Capital Group. Copyright © 2025 S&P Dow Jones Indices LLC, a division of S&P Global, and/or its affiliates. All rights reserved. Redistribution or reproduction in whole or in part are prohibited without written permission of S&P Dow Jones Indices LLC.
FTSE source: London Stock Exchange Group plc and its group undertakings (collectively, the "LSE Group"). © LSE Group 2025. FTSE Russell is a trading name of certain of the LSE Group companies. "FTSE®" is a trade mark of the relevant LSE Group companies and is used by any other LSE Group company under licence. All rights in the FTSE Russell indices or data vest in the relevant LSE Group company which owns the index or the data. Neither LSE Group nor its licensors accept any liability for any errors or omissions in the indices or data and no party may rely on any indices or data contained in this communication. No further distribution of data from the LSE Group is permitted without the relevant LSE Group company's express written consent. The LSE Group does not promote, sponsor or endorse the content of this communication. The index is unmanaged and cannot be invested in directly.
BLOOMBERG® is a trademark and service mark of Bloomberg Finance L.P. and its affiliates (collectively “Bloomberg”). Bloomberg or Bloomberg’s licensors own all proprietary rights in the Bloomberg Indices. Neither Bloomberg nor Bloomberg’s licensors approves or endorses this material, or guarantees the accuracy or completeness of any information herein, or makes any warranty, express or implied, as to the results to be obtained therefrom and, to the maximum extent allowed by law, neither shall have any liability or responsibility for injury or damages arising in connection therewith.
MSCI does not approve, review or produce reports published on this site, makes no express or implied warranties or representations and is not liable whatsoever for any data represented. You may not redistribute MSCI data or use it as a basis for other indices or investment products.
Capital believes the software and information from FactSet to be reliable. However, Capital cannot be responsible for inaccuracies, incomplete information or updating of the information furnished by FactSet. The information provided in this report is meant to give you an approximate account of the fund/manager's characteristics for the specified date. This information is not indicative of future Capital investment decisions and is not used as part of our investment decision-making process.
Indices are unmanaged and cannot be invested in directly. Returns represent past performance, are not a guarantee of future performance, and are not indicative of any specific investment.
All Capital Group trademarks are owned by The Capital Group Companies, Inc. or an affiliated company in Canada, the U.S. and other countries. All other company names mentioned are the property of their respective companies.
Capital Group funds are offered in Canada by Capital International Asset Management (Canada), Inc., part of Capital Group, a global investment management firm originating in Los Angeles, California in 1931. Capital Group manages equity assets through three investment groups. These groups make investment and proxy voting decisions independently. Fixed income investment professionals provide fixed income research and investment management across the Capital organization; however, for securities with equity characteristics, they act solely on behalf of one of the three equity investment groups.
The Capital Group funds offered on this website are available only to Canadian residents.
 Craig Beacock
 Kathrin Forrest