Global Equities
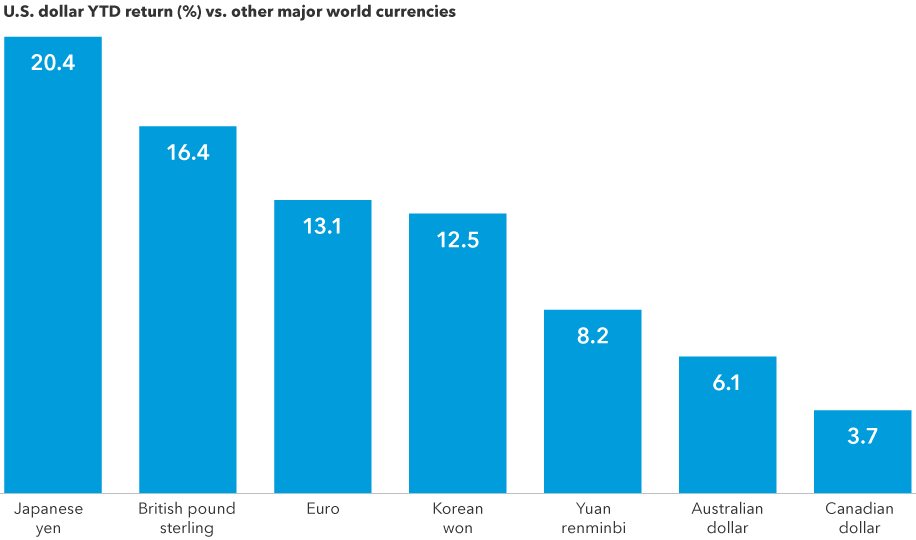
There’s no denying that the relentless rise of the U.S. dollar has been challenging for investors in international equities. The currency translation effect (that is, losses and gains resulting from the conversion of non-U.S. investment returns into U.S. dollars) has dented international and global equity portfolio results.
There are two ways currency movements can affect investors. In addition to translation effects at the portfolio level, companies within a portfolio may experience business impacts. However, a strong U.S. dollar is not always bad news for non-U.S. companies.
Specific companies with solid fundamentals can disproportionately benefit from foreign exchange swings. Exchange-rate volatility can have a big impact on corporate profitability, depending on where a company generates revenue or incurs costs. Companies with significant costs in euros or yen and a lot of revenue in U.S. dollars, for example, could be poised to benefit. In this environment, research is crucial to understanding how exchange-rate volatility can affect profitability. Ultimately, underlying company fundamentals should drive investment decisions rather than near-term currency fluctuations.
How strong is the U.S. dollar?

Sources: Capital Group, ICE Data Services, MSCI, RIMES. As of August 19, 2022.
Strong USD can cut both ways
In today’s global economy, it is common for multinational companies to have geographically diverse income sources, and manufacturing hubs and suppliers located across the world. For example, as of September 14, 2022, companies in the S&P 500 Index derive about 40% of their revenue from outside the United States. When the dollar is strong, this dynamic can put pressure on these companies’ profits, as the money coming in from abroad is not worth as much as it is when the dollar is weak.
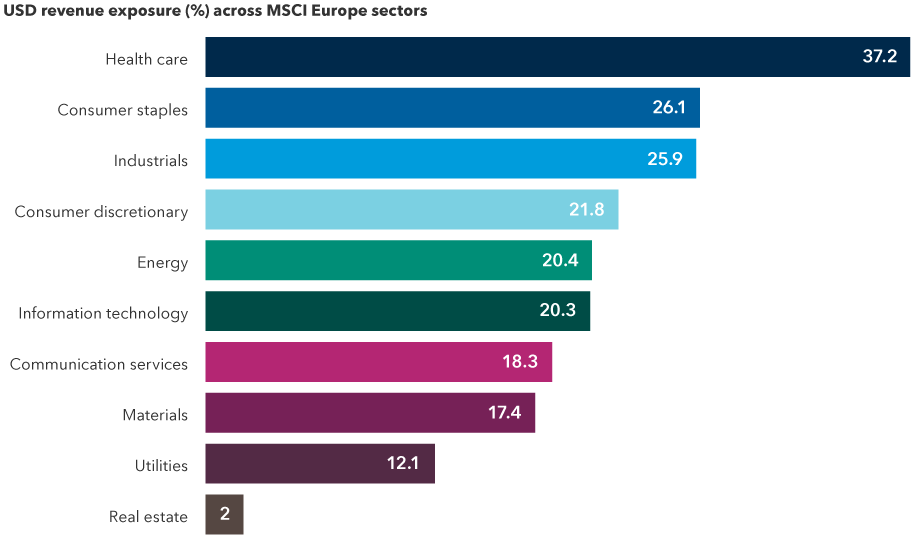
The inverse can be true for non-U.S. companies, too. Multiple sectors within the MSCI Europe Index, for example, pull in significant U.S.-dollar-based revenue. Industries that might typically benefit from wide dispersion between the U.S. dollar and other currencies include autos, electronics, shipbuilders, machinery, aerospace and defence, and luxury goods.
Many non-U.S. companies have substantial U.S.- dollar-based revenue

Sources: Capital Group, FactSet, Refinitiv Datastream. Revenue exposure above reflects the weighted average of the percentage of revenue generated in the United States across each index's respective constituents. Constituent lists are current as of August 23, 2022; company-level revenue exposure is estimated by FactSet and is current as of January 2022.
There are several competing factors that can drive profits beyond currency moves, and many companies hedge their currency exposures to help protect their balance sheets from unexpected swings. However, there are numerous examples of non-U.S. companies citing the strong dollar as being beneficial to their bottom line this year.
One is United Kingdom–based aerospace company BAE, which brings in about 47% of its revenue in dollars. On BAE’s most recent earnings call, executives explained that, “Should the current dollar (exchange) rate persist for the year, there will be a significant tailwind to reported results.” If the pound were to weaken another 10 cents against the dollar, the company estimates its underlying earnings before interest and taxes (EBIT) guidance could be retranslated upward by as much as 10%.
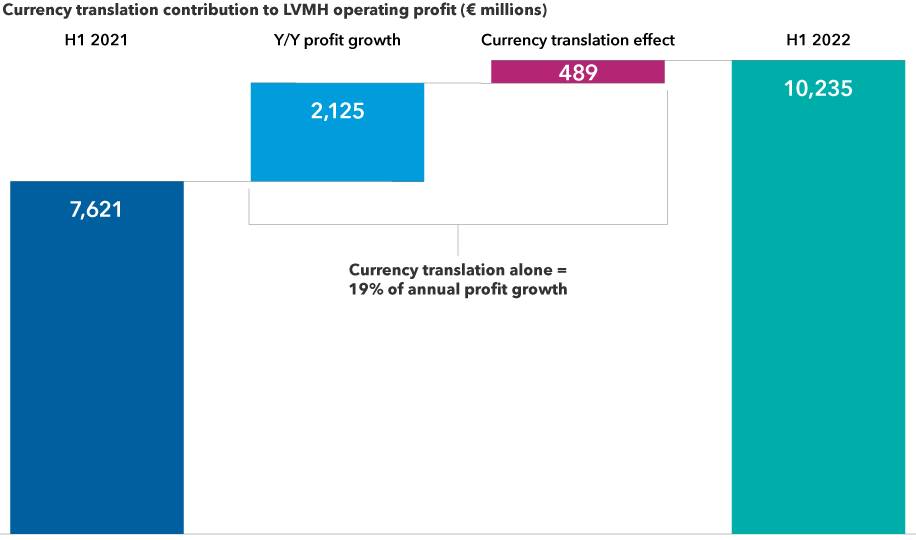
French consumer discretionary giant LVMH, which owns luxury goods maker Louis Vuitton, provides another compelling illustration of the positive impact a U.S. strong dollar can have on non-U.S. companies. In a recent shareholder presentation, LVMH (which counts about 27% of its revenue in dollars) noted that currency effects have boosted its profits by more than 400 million euros through the first half of 2022. Currency impact alone accounted for about 19% of its improvement in operating profit on a year-over-year basis.
Currency translation can boost earnings growth for select companies

Sources: Capital Group, company filings. Periods above refer to the six-month fiscal periods ending June 30, 2021, and June 30, 2022, respectively.
French drugmaker Sanofi has also been a beneficiary of the strong dollar. It reported that currency effects boosted its sales by nearly 1 billion euros in the first half of 2022 and pushed its earnings per share up by 0.19 euros.
Dollar poised to stay strong
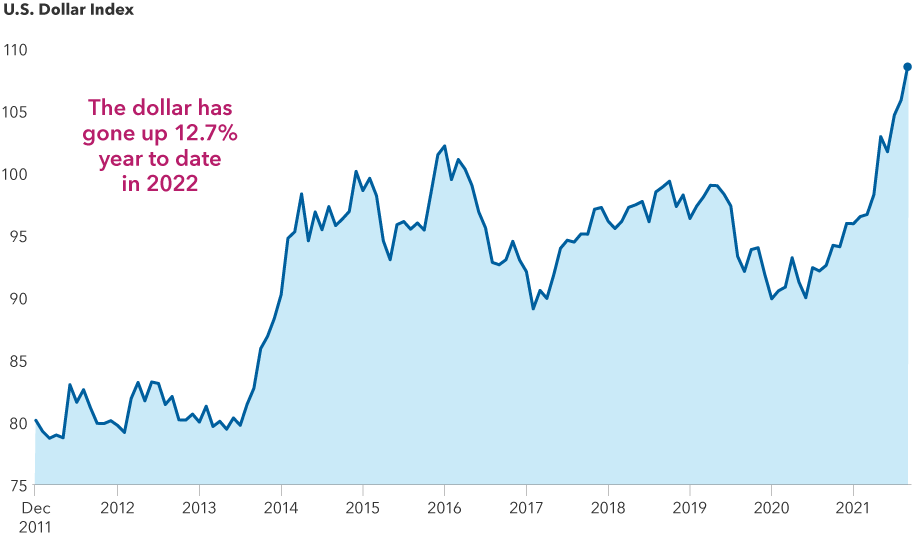
These factors are likely to be relevant for some time. According to Capital Group currency analyst Jens Sondergaard, the dollar is rising for good reason and may not yet be at its peak. As he explains, the U.S. economy is stronger than that of other major countries, and the U.S. Federal Reserve is aggressively tightening to blunt the impact of inflationary pressures.
In most other parts of the world, it’s a very different story. Outside the U.S., there has been lacklustre growth, inflation that’s mostly driven by energy prices and severe compression of real wages. As a result, central banks are being forced into what Sondergaard characterizes as “bad” rate hikes.
The dollar’s ascent appears set to continue

Sources: Capital Group, ICE Data Services, Refinitiv Datastream. Data as of July 29, 2022.
Hedging equities can be challenging
Coming to the currency translation effect, investors seeking to mitigate exchange-rate volatility can, of course, choose to implement a hedging strategy (which would typically use forward currency contracts). Hedging can be appropriate when investors have a view that a given currency is either under- or overvalued, or to reduce currency risk.
But many studies have shown that hedging equities may not be worth the cost. These currency strategies have tended to have a relatively small impact on a stock portfolio’s longer-term volatility and return. This is different from bond portfolios, where currencies can be a more significant source of risk and return. In fixed income, currency hedging can be effective based on an investor’s views of currencies in specific markets.
At Capital Group, generally, each portfolio manager can choose to implement a hedging strategy for the equity assets they manage within a strategy or mutual fund. Over the past five years, Capital Group’s international and global equity portfolios have typically had less than 5% of their assets hedged.
Bottom line
Active management can help discern which companies could benefit from a strong U.S. dollar. This year’s massive currency moves are creating tailwinds for certain companies, and the repercussions of an appreciating dollar can vary widely. In our view, research is key to assessing the likely effects of currencies on a specific company's prospects and its stock’s return potential.
S&P 500 Index is a market-capitalization-weighted index based on the results of 500 widely held common stocks.
MSCI Europe Index is a free float-adjusted market capitalization-weighted index that is designed to measure results of more than 10 developed equity markets in Europe. Results reflect dividends net of withholding taxes. This index is unmanaged, and its results include reinvested dividends and/or distributions but do not reflect the effect of sales charges, commissions, account fees, expenses or U.S. federal income taxes.
Our latest insights
-
-
-
U.S. Equities
-
Global Equities
-
Emerging Markets
Commissions, trailing commissions, management fees and expenses all may be associated with investments in investment funds. Please read the prospectus before investing. Investment funds are not guaranteed or covered by the Canada Deposit Insurance Corporation or by any other government deposit insurer. For investment funds other than money market funds, their values change frequently. For money market funds, there can be no assurances that the fund will be able to maintain its net asset value per security at a constant amount or that the full amount of your investment in the fund will be returned to you. Past performance may not be repeated.
Unless otherwise indicated, the investment professionals featured do not manage Capital Group‘s Canadian investment funds.
References to particular companies or securities, if any, are included for informational or illustrative purposes only and should not be considered as an endorsement by Capital Group. Views expressed regarding a particular company, security, industry or market sector should not be considered an indication of trading intent of any investment funds or current holdings of any investment funds. These views should not be considered as investment advice nor should they be considered a recommendation to buy or sell.
Statements attributed to an individual represent the opinions of that individual as of the date published and do not necessarily reflect the opinions of Capital Group or its affiliates. This information is intended to highlight issues and not be comprehensive or to provide advice. For informational purposes only; not intended to provide tax, legal or financial advice. Capital Group funds are available in Canada through registered dealers. For more information, please consult your financial and tax advisors for your individual situation.
Forward-looking statements are not guarantees of future performance, and actual events and results could differ materially from those expressed or implied in any forward-looking statements made herein. We encourage you to consider these and other factors carefully before making any investment decisions and we urge you to avoid placing undue reliance on forward-looking statements.
The S&P 500 Composite Index (“Index”) is a product of S&P Dow Jones Indices LLC and/or its affiliates and has been licensed for use by Capital Group. Copyright © 2025 S&P Dow Jones Indices LLC, a division of S&P Global, and/or its affiliates. All rights reserved. Redistribution or reproduction in whole or in part are prohibited without written permission of S&P Dow Jones Indices LLC.
FTSE source: London Stock Exchange Group plc and its group undertakings (collectively, the "LSE Group"). © LSE Group 2025. FTSE Russell is a trading name of certain of the LSE Group companies. "FTSE®" is a trade mark of the relevant LSE Group companies and is used by any other LSE Group company under licence. All rights in the FTSE Russell indices or data vest in the relevant LSE Group company which owns the index or the data. Neither LSE Group nor its licensors accept any liability for any errors or omissions in the indices or data and no party may rely on any indices or data contained in this communication. No further distribution of data from the LSE Group is permitted without the relevant LSE Group company's express written consent. The LSE Group does not promote, sponsor or endorse the content of this communication. The index is unmanaged and cannot be invested in directly.
BLOOMBERG® is a trademark and service mark of Bloomberg Finance L.P. and its affiliates (collectively “Bloomberg”). Bloomberg or Bloomberg’s licensors own all proprietary rights in the Bloomberg Indices. Neither Bloomberg nor Bloomberg’s licensors approves or endorses this material, or guarantees the accuracy or completeness of any information herein, or makes any warranty, express or implied, as to the results to be obtained therefrom and, to the maximum extent allowed by law, neither shall have any liability or responsibility for injury or damages arising in connection therewith.
MSCI does not approve, review or produce reports published on this site, makes no express or implied warranties or representations and is not liable whatsoever for any data represented. You may not redistribute MSCI data or use it as a basis for other indices or investment products.
Capital believes the software and information from FactSet to be reliable. However, Capital cannot be responsible for inaccuracies, incomplete information or updating of the information furnished by FactSet. The information provided in this report is meant to give you an approximate account of the fund/manager's characteristics for the specified date. This information is not indicative of future Capital investment decisions and is not used as part of our investment decision-making process.
Indices are unmanaged and cannot be invested in directly. Returns represent past performance, are not a guarantee of future performance, and are not indicative of any specific investment.
All Capital Group trademarks are owned by The Capital Group Companies, Inc. or an affiliated company in Canada, the U.S. and other countries. All other company names mentioned are the property of their respective companies.
Capital Group funds are offered in Canada by Capital International Asset Management (Canada), Inc., part of Capital Group, a global investment management firm originating in Los Angeles, California in 1931. Capital Group manages equity assets through three investment groups. These groups make investment and proxy voting decisions independently. Fixed income investment professionals provide fixed income research and investment management across the Capital organization; however, for securities with equity characteristics, they act solely on behalf of one of the three equity investment groups.
The Capital Group funds offered on this website are available only to Canadian residents.
 Steve Caruthers
 Steven Sperry