Credit
 Damien McCann
Credit markets have remained robust, even as interest rates have soared to multi-decade highs. In this interview, Damien McCann, portfolio manager for Capital Group Multi-Sector Income FundTM (Canada), explains why he expects this resilience to continue, and, more broadly, discusses the opportunities he sees in multi-sector credit portfolios designed to generate income from a combination of corporate bonds, emerging markets bonds and securitized credit.
What is your view on the state of credit markets today? Where are you seeing the opportunities and the risks?
Overall, this is a constructive backdrop for credit. I think credit markets are broadly investable today, and now is not the time to have a big underweight to credit. From a fundamental perspective, I expect improved economic growth. Our economists expect global gross domestic product (GDP) growth of about 3% in 2024. This is lower than the growth rates we saw in the years before the pandemic. But it is still solid, and the decline is attributable primarily to slower growth in China.
I also expect inflation to continue coming down gradually. Disinflation has been a bit slower than central banks would like, but there should still be enough space to begin lowering policy rates as we look out over the next few quarters. Additionally, corporate, consumer and emerging markets government balance sheets are not excessively leveraged and fairly stable overall.
This isn't to say that credit fundamentals are fine everywhere, but the problems I see are more idiosyncratic and could be ascribed to individual industries or issuers. Technicals also appear supportive. Now that rates are a lot higher, borrowers are choosing to borrow less or for shorter periods of time. Higher rates are also creating more interest in credit from lenders and bond investors, such as ourselves.
This is reflected in significant inflows into bond funds. Cash is coming off the sidelines as investors are pulling out of money market funds and taking the opportunity to invest in elevated yields for a longer period of time.
U.S. corporate bond issuance lags after pandemic surge
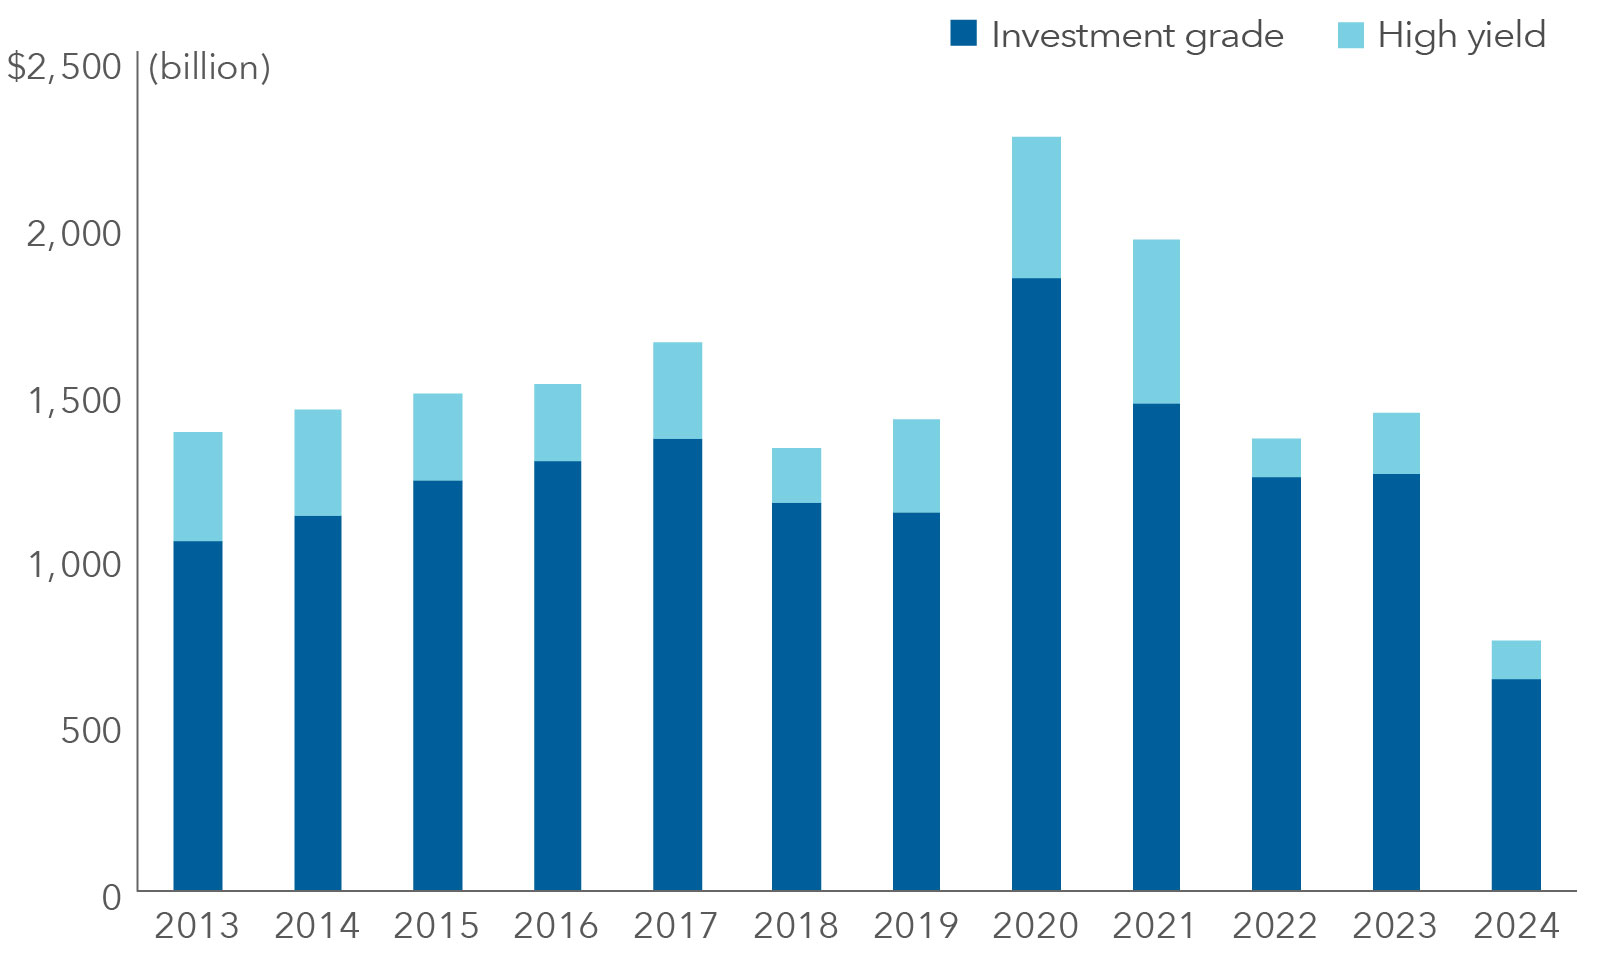
Source: SIFMA. Data as of April 30, 2024. Investment grade = BBB/Baa and above. Values in USD.
What about valuations? Spreads have tightened significantly this year. How is that factoring into your investment strategy?
Currently, I see the most attractive opportunities in investment-grade corporates and securitized credit. I see some risk in high yield, although it’s not really a concern about fundamentals but more of a concern that valuations have become excessive relative to other sectors.
It is true that spreads have tightened, but they remain in a normal range for a non-crisis period. My view is that, based on supportive fundamentals and technicals, it would be odd if spreads were much wider than they are today.
Also, credit markets are enormous, and spreads are not uniformly tight across sectors. Different sectors have distinct underlying credit drivers. A corporate borrower’s credit quality is determined by different factors than a sovereign issuer’s ability to repay, or a subprime auto borrower’s ability to service debt. As a result, valuations, yields and spreads are not the same across these markets, and they don’t move around in a perfectly correlated fashion.
Financials are among the largest issuers of corporate bonds. What is the state of the banking industry today?
We’ve seen quite a recovery from the events of March 2023. The root causes of Silicon Valley Bank’s collapse (among others) were linked to a combination of factors, including some unique customer concentrations and herd behaviour, as well as excessive commercial real estate exposure and interest rate sensitivity in U.S. Treasury holdings.
We’re still waiting on all of the details, but we expect the Fed to further tighten regulations on banks as they did in the aftermath of the global financial crisis. This is likely going to mean banks need to hold more capital than they did before last March and maintain more liquid balance sheets.
In the U.S., the larger banks were already very well capitalized and remain so. They were able to provide support in concert with the Fed to stabilize markets and provide resolutions for the handful of banks that got into trouble.
All else being equal, I expect the incoming regulation will mean credit quality for banks is going to go up, and their return on equity is going to go down. That should be a relative positive for bond investors and a relative negative for equity investors.
As the Federal Reserve and other central banks lower rates, it should be broadly positive for financials. It should mean that net interest margins, a key measure of bank profitability, should improve as funding costs fall. Demand for loans could also improve across commercial, industrial and consumer sectors, including mortgages, when it becomes cheaper to borrow.
Investment-grade credit market has evolved and expanded
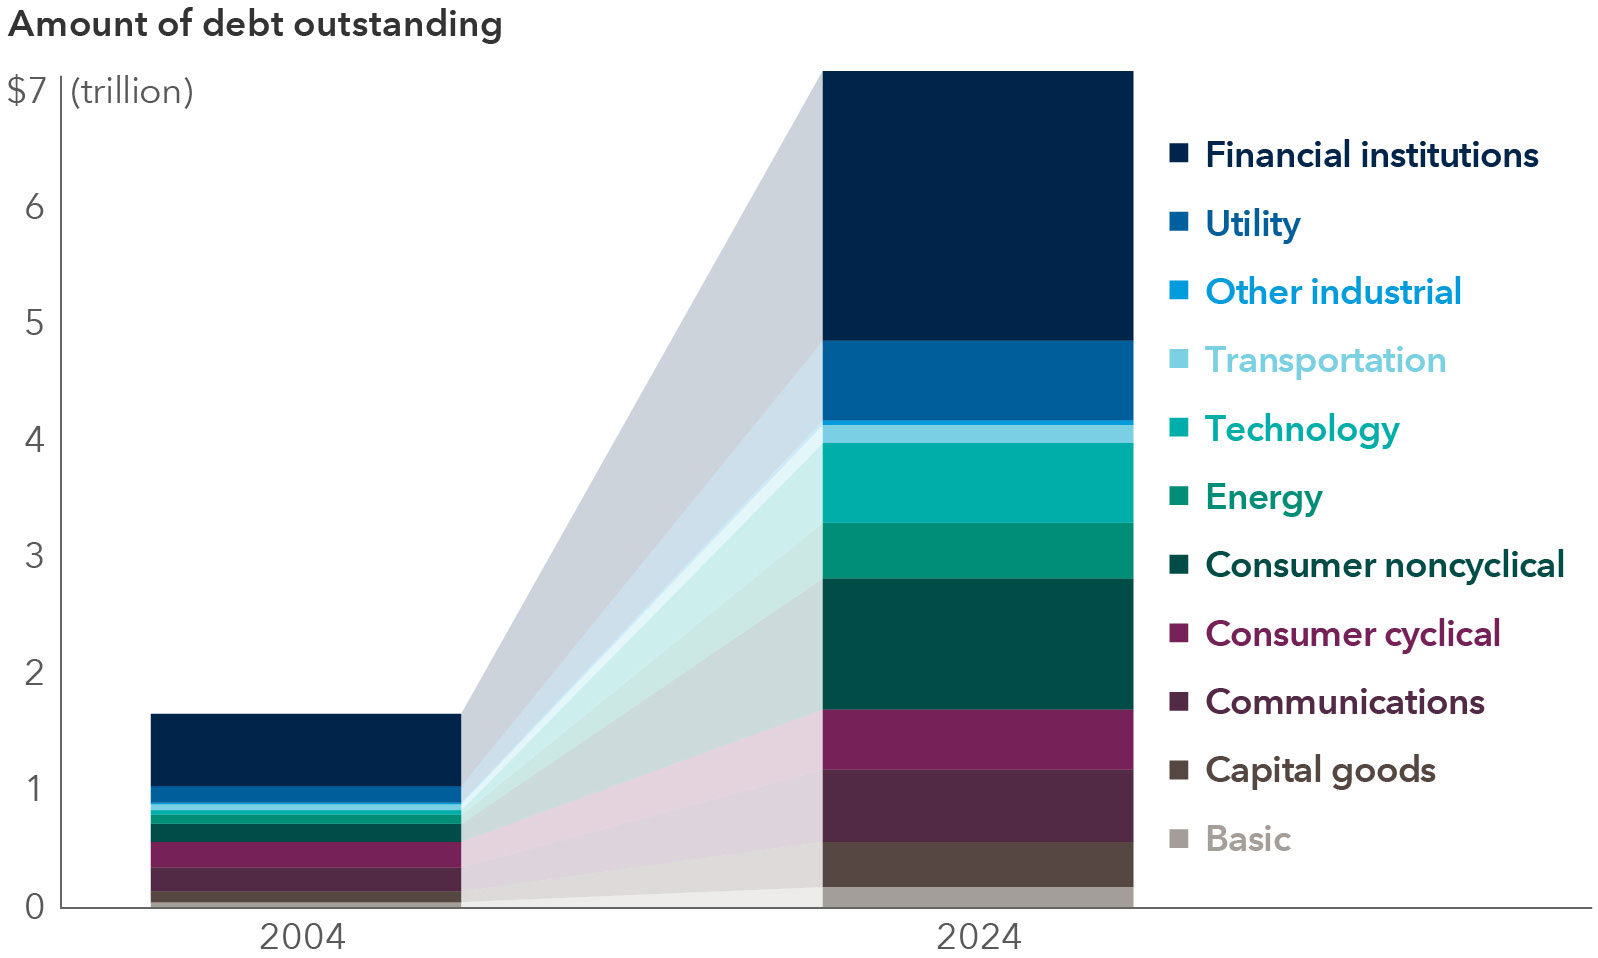
Source: Bloomberg. Chart shows sector allocations within the Bloomberg U.S. Corporate Investment Grade Index. Data as of May 29, 2024. Values in USD.
As a portfolio manager of multi-sector income strategies, where are you seeing opportunities, and where are you being more cautious in both investment-grade and high-yield sectors?
If you look at 10-year BBB-rated U.S. corporates, which is arguably the core of the investment-grade market, spreads are not at historic tights and could tighten further.
More broadly in investment grade, we see opportunities in select pharmaceutical companies. These companies tend to be very good businesses with strong cash flows and demand that is not sensitive to the economy. There are some situations where pharmaceutical companies have made debt-financed acquisitions and are now going to use their free cash flow to repay that debt. As debt levels fall, we expect credit spreads to tighten. This would drive higher bond returns, which could be comparable to many of the return opportunities available in the high-yield market, but with a significantly lower risk profile.
We’re also finding value in certain utilities that are facing elevated wildfire risk but have credible plans to harden their distribution systems, thereby potentially reducing wildfire risk going forward.
At the sector level, I’m cautious on high yield. This is not because of the underlying credit fundamentals, but due to the ultra-tight spreads for many high-yield issuers, relative to history and compared to spreads in other sectors. Within high yield, at the industry level, I’m being very selective and careful in telecoms, cable and satellite companies. There are a number of companies here that are simply too levered for the more competitive environment that has emerged in those industries.
Where do you see opportunities in securitized credit?
Securitized credit plays an important role in multi-sector income portfolios as a diversifier to corporate and sovereign credit. The drivers of securitized credit are unique in areas like consumer lending, either secured or unsecured, sometimes tied to particular assets like car loans — or commercial real estate mortgages or non-agency residential mortgages or collateralized loan obligations.
I’d highlight subprime autos in this area. From a fundamental perspective, a strong job market supports borrowers’ ability to service their debt. We like the structure of these securities: They have shorter maturities, and the leverage declines over the life of the bond as borrowers make payments. In this context, 6% to 8% yields are quite attractive.
That being said, securitized credit overall is less liquid, and an important driver of excess returns over time in a multi-sector credit portfolio is shifting between sector exposures. It is harder to flex securitized exposure up and down, given the lower liquidity. Therefore, it can make sense to limit its size in portfolios and focus more on sectors where it is possible to be more flexible.
What’s your process for deciding relative value among sectors?
Our approach to sector allocation within multi-sector portfolios relies on a combination of top-down and bottom-up inputs, as well as viewing sector allocations through a risk lens.
The starting point for our sector allocation strategy is the Portfolio Strategy Group’s views on the overall attractiveness of credit. This sets the overall tone for the amount of credit risk we’ll take in multi-sector portfolios such as our Multi-Sector Income portfolio available in Canada.
Next, we look at relative valuations between sectors in a historical context, going back multiple decades. Relative valuations have been cyclical and have tended to revert to the mean over time, and we believe that behaviour should continue. These patterns have been driven by a combination of economic and market cycles, as well as underlying borrower behaviour.
Take the history of the high-yield sector as an example: During periods of strong markets and low volatility, high-yield issuers tend to gradually take more risk in how they manage their businesses and balance sheets. Eventually, this risk-taking behaviour goes too far, which is often revealed when there’s a slowdown in the economy. Then high-yield borrowers must course correct, and you'll see cost cutting, reduced capital spending, and often asset sales, as they look to repay debt and shore up operations and profitability. This pattern has played out again and again over time.
With this in mind, we often take a countercyclical approach to sector allocation, reducing exposure to higher yielding, lower quality sectors after periods of spread tightening and strong results, while simultaneously expanding exposure to lower yielding, higher quality sectors. We then look to add back exposure to higher yielding, lower quality sectors after a period of spread widening and lower returns, in anticipation of issuers in that sector taking steps to improve credit quality.
A quantitative model also helps us identify relative valuation dislocations at the sector level. We take the quant model’s signals as a starting point for sector allocation, and then overlay forward-looking views on fundamentals and technicals from each of the sector level portfolio management and analyst teams across high yield, investment grade, emerging markets, and securitized credit.
Lastly, we look at the potential risk factors that could affect different sector allocations, considering various economic and market scenarios so that we understand correlations and the potential volatility of an overall multi-sector income portfolio.
Bloomberg U.S. Corporate Investment Grade Index represents the universe of investment grade, publicly issued U.S. corporate and specified foreign debentures and secured notes that meet the specified maturity, liquidity, and quality requirements. This index is unmanaged, and its results include reinvested distributions but do not reflect the effect of sales charges, commissions, account fees, expenses or income taxes.
Our latest insights
-
-
Market Volatility
-
-
-
U.S. Equities
Commissions, trailing commissions, management fees and expenses all may be associated with investments in investment funds. Please read the prospectus before investing. Investment funds are not guaranteed or covered by the Canada Deposit Insurance Corporation or by any other government deposit insurer. For investment funds other than money market funds, their values change frequently. For money market funds, there can be no assurances that the fund will be able to maintain its net asset value per security at a constant amount or that the full amount of your investment in the fund will be returned to you. Past performance may not be repeated.
Unless otherwise indicated, the investment professionals featured do not manage Capital Group‘s Canadian investment funds.
References to particular companies or securities, if any, are included for informational or illustrative purposes only and should not be considered as an endorsement by Capital Group. Views expressed regarding a particular company, security, industry or market sector should not be considered an indication of trading intent of any investment funds or current holdings of any investment funds. These views should not be considered as investment advice nor should they be considered a recommendation to buy or sell.
Statements attributed to an individual represent the opinions of that individual as of the date published and do not necessarily reflect the opinions of Capital Group or its affiliates. This information is intended to highlight issues and not be comprehensive or to provide advice. For informational purposes only; not intended to provide tax, legal or financial advice. Capital Group funds are available in Canada through registered dealers. For more information, please consult your financial and tax advisors for your individual situation.
Forward-looking statements are not guarantees of future performance, and actual events and results could differ materially from those expressed or implied in any forward-looking statements made herein. We encourage you to consider these and other factors carefully before making any investment decisions and we urge you to avoid placing undue reliance on forward-looking statements.
The S&P 500 Composite Index (“Index”) is a product of S&P Dow Jones Indices LLC and/or its affiliates and has been licensed for use by Capital Group. Copyright © 2025 S&P Dow Jones Indices LLC, a division of S&P Global, and/or its affiliates. All rights reserved. Redistribution or reproduction in whole or in part are prohibited without written permission of S&P Dow Jones Indices LLC.
FTSE source: London Stock Exchange Group plc and its group undertakings (collectively, the "LSE Group"). © LSE Group 2025. FTSE Russell is a trading name of certain of the LSE Group companies. "FTSE®" is a trade mark of the relevant LSE Group companies and is used by any other LSE Group company under licence. All rights in the FTSE Russell indices or data vest in the relevant LSE Group company which owns the index or the data. Neither LSE Group nor its licensors accept any liability for any errors or omissions in the indices or data and no party may rely on any indices or data contained in this communication. No further distribution of data from the LSE Group is permitted without the relevant LSE Group company's express written consent. The LSE Group does not promote, sponsor or endorse the content of this communication. The index is unmanaged and cannot be invested in directly.
BLOOMBERG® is a trademark and service mark of Bloomberg Finance L.P. and its affiliates (collectively “Bloomberg”). Bloomberg or Bloomberg’s licensors own all proprietary rights in the Bloomberg Indices. Neither Bloomberg nor Bloomberg’s licensors approves or endorses this material, or guarantees the accuracy or completeness of any information herein, or makes any warranty, express or implied, as to the results to be obtained therefrom and, to the maximum extent allowed by law, neither shall have any liability or responsibility for injury or damages arising in connection therewith.
MSCI does not approve, review or produce reports published on this site, makes no express or implied warranties or representations and is not liable whatsoever for any data represented. You may not redistribute MSCI data or use it as a basis for other indices or investment products.
Capital believes the software and information from FactSet to be reliable. However, Capital cannot be responsible for inaccuracies, incomplete information or updating of the information furnished by FactSet. The information provided in this report is meant to give you an approximate account of the fund/manager's characteristics for the specified date. This information is not indicative of future Capital investment decisions and is not used as part of our investment decision-making process.
Indices are unmanaged and cannot be invested in directly. Returns represent past performance, are not a guarantee of future performance, and are not indicative of any specific investment.
All Capital Group trademarks are owned by The Capital Group Companies, Inc. or an affiliated company in Canada, the U.S. and other countries. All other company names mentioned are the property of their respective companies.
Capital Group funds are offered in Canada by Capital International Asset Management (Canada), Inc., part of Capital Group, a global investment management firm originating in Los Angeles, California in 1931. Capital Group manages equity assets through three investment groups. These groups make investment and proxy voting decisions independently. Fixed income investment professionals provide fixed income research and investment management across the Capital organization; however, for securities with equity characteristics, they act solely on behalf of one of the three equity investment groups.
The Capital Group funds offered on this website are available only to Canadian residents.