Market Volatility
 Jared Franz
 Gerald Du Manoir
 Chris Buchbinder
 John Queen
 Steve Watson
With global equity markets selling off sharply in the first few days of August, investor sentiment has quickly shifted from exuberance to apprehension. Concerns about softening U.S. economic growth, high interest rates and technology sector valuations have combined to shake confidence in a market that was previously priced for perfection.
At such times of stress in the markets, it’s important to take a step back, review the fundamentals, and determine whether the current volatility is perhaps an overreaction or an expected correction after a long stretch of strong returns.
Here are five views from Capital Group investment professionals assessing the latest, fast-changing market developments.
Macro view remains positive
Jared Franz, U.S. economist
We're in the summer season where market liquidity is low and so markets generally overshoot based on positive and negative news. That's unlikely to change in the next few weeks so I'd expect more volatility to come.
On the economic side I'm not seeing anything in the data that would suggest a sharp drop-off or a change in the fundamentals of the U.S. economy. Most of what I'm seeing is a slump in the pace of economic activity, but not necessarily a contraction.
A flagging economy is generally consistent with weakening labour markets and wages, which have the effect of slowing the pace of consumption. That said, if we continue to see economic data weakening across the board, consistent with U.S. unemployment rising above 4.5% to 5.0%, I think that would lay the groundwork for more interest rate cuts from the U.S. Federal Reserve than the market has priced in right now. Another key change and difference versus three to six months ago is the pace of economic activity in Europe and China, which has been much slower of late.
Global equity markets have experienced a strong run-up until now
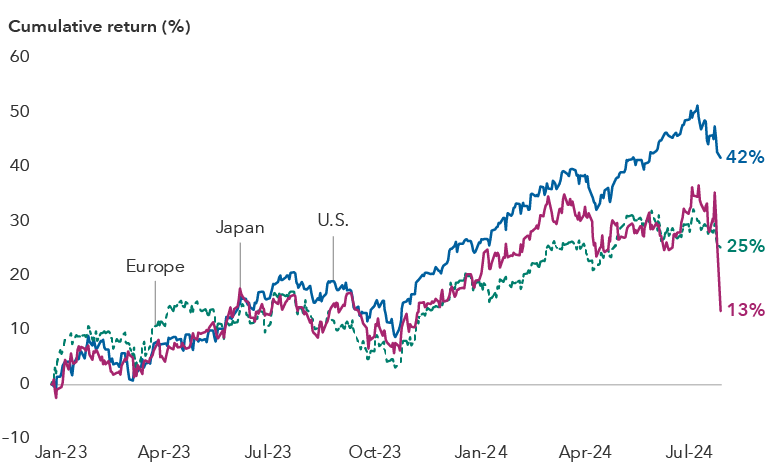
Sources: MSCI, RIMES, Standard & Poor's. Returns are cumulative total returns in S&P 500 Index, MSCI Europe and MSCI Japan from January 1, 2023, to August 5, 2024. August 5 data is based on intraday values.
Even with a modestly slowing economy, U.S. corporate earnings have been robust. Overall, equity markets remain reasonably priced with the S&P 500 Index trading at a multiple of 20.8 times 12-month forward earnings, and even the Magnificent Seven (ex-Tesla) at 27.8 times, as of August 2. And even though the market selloff has been at least partly triggered by worry that the Fed may be behind the curve in lowering rates, the fact is that we are at the beginning of an easing cycle with both nominal and real interest rates that are not exceedingly high by historical standards.
Taken altogether, this feels more like a serious pocket of turbulence rather than a full-blown contraction.
Equity markets were primed for a fall
Gerald Du Manoir, portfolio manager, Capital Group International Equity Fund™ (Canada)
We have witnessed a period of hyperconcentration where the market was suggesting that only a few companies deserved to be trading at higher multiples. Investors were very focused on themes. Going forward, I expect the market to be more focused on company fundamentals, regardless of the theme, whether it is artificial intelligence (AI) or weight loss drugs, or value or growth.
In the last few years, a number of solid companies’ valuations compressed as the market focused on tech and AI. Many of those companies have held up relatively well recently. I think this correction is telling us is that, going forward, it will be crucial to focus on company fundamentals. A balanced and diversified approach will be essential. And, eventually, the fundamentals will reassert themselves.
AI entering a zone of disillusionment
Chris Buchbinder, portfolio manager, Capital Group U.S. Equity Fund™ (Canada)
A correction in AI-related stocks was to be expected. There has been a great amount of enthusiasm around AI, just as there was around the internet in 2000. I think AI is absolutely real and will change all of our lives in dramatic ways over the next five to 10 years. But I also think we are entering a zone of disillusionment. With any growth trend, there is a period when fundamentals may slow, and while they may end up being great over the long term, you can get extreme reactions in the market.
Indeed, while the recent equity market selloff has been swift and powerful, it has been most acute among so-called momentum stocks, or stocks whose share prices have been trending in one direction for a period. Many dividend payers and quality companies, or those companies with visible near-term cash flow generation, have held up relatively well.
Momentum stocks have taken the brunt of the selloff
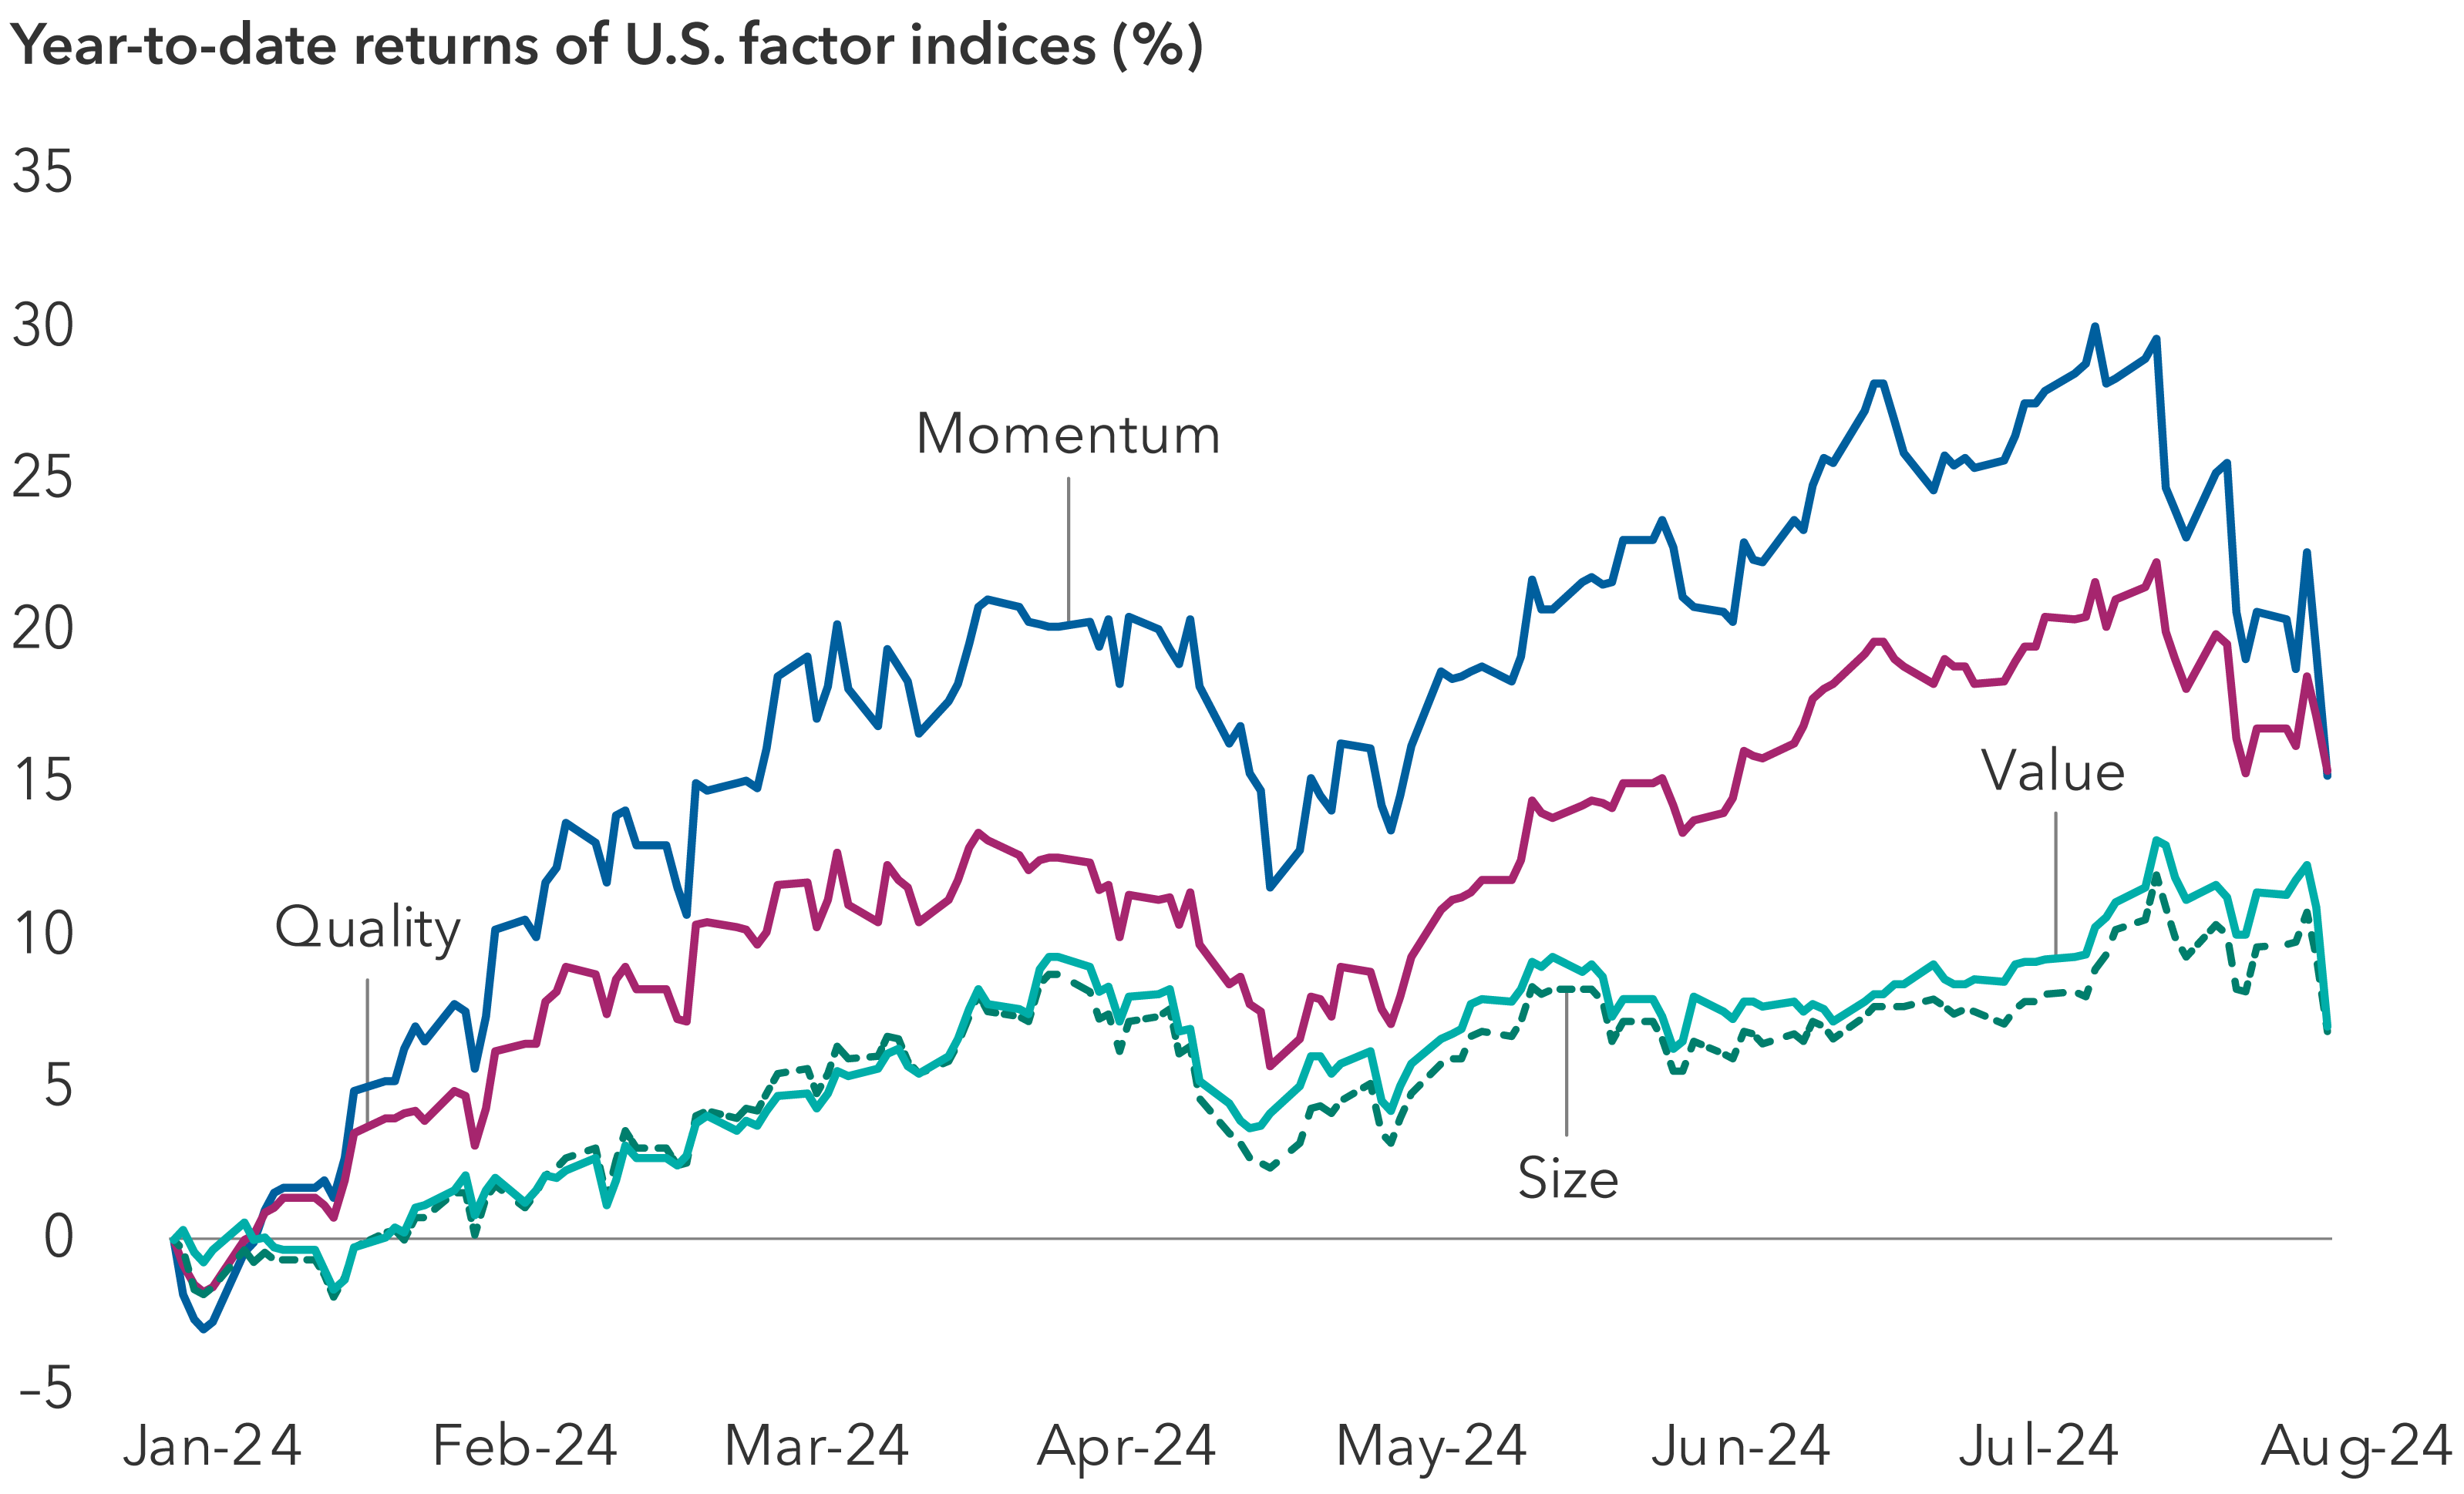
Source: MSCI. Factor indices are components of the MSCI USA Index. Returns shown are total returns from January 1, 2024, through August 2, 2024. Returns are in USD.
Bonds holding up amid stock market plunge
Rates markets offered some respite during this broad equity downturn, as U.S. Treasuries rallied significantly in reaction to Friday’s jobs report. Investors seeking shelter amid heightened recession fears pushed Treasury yields down significantly last week, while equities fell and credit spreads widened. (Bond yields move inversely to prices.)
These market moves follow a weaker-than-expected payroll report in the U.S. on Friday showing slower job growth and an unemployment rate that rose to 4.3% from 4.1% in June, triggering the Sahm Rule, which states that such a rise in the unemployment rate from a trough has never occurred without a recession. Last week, the Fed held rates steady at a range of 5.25% to 5.50% for the eighth consecutive time. Fed chair Jerome Powell signaled that cuts could come as soon as September, but markets are questioning whether a standard 25-basis-point reduction will be too little too late.
With higher starting yields across the curve, bonds have been able to do what they are meant to do when equities sell off. The negative correlation between bonds and stocks serves as a reminder of the importance of diversification and the role of fixed income in investors’ portfolios.
Friday’s job numbers continued to show moderation and might show us on a path to real weakness and recession, but it is not clear we are on one yet. Given the violent swings we have seen year to date due to individual economic data releases and market expectations for rate cuts, we believe it is prudent to remain forward-looking and focused on the bigger picture when identifying the right time to adjust positions.
Japan provided initial sparks for global selloff
Steve Watson, portfolio manager, Capital Group Capital Income Builder™ (Canada)
A spike in the value of the Japanese yen may also be contributing to market volatility in the U.S. Last week, the Bank of Japan surprised markets by raising its benchmark interest rate 15 basis points to 0.25% — its highest level since the global financial crisis — and announced a plan to pare back its quantitative easing program. This led the yen to appreciate significantly against the U.S. dollar.
The impact has been felt by Japanese equity markets, which fell sharply, and it could be filtering through to the U.S. The yen has been a currency of choice for many investors executing so-called carry trades, in which they borrow in a low-yielding currency to invest in other higher yielding currencies or assets. With the yen rebounding dramatically, investors in these trades could be selling other assets, including U.S. stocks, to find liquidity to cover their losses and fund capital calls. However, it is difficult to quantify the magnitude of any such effect.
Some would say that the recent strength of the Japanese yen has caused investors in Japan to shift out of the Magnificent Seven stocks, which has led the U.S. market down. Perhaps so. But I’d say a more probable answer is that U.S.-listed growth stocks just got too expensive and now need some time to correct.
Meanwhile, Japanese stocks have rallied over the past year on expectations of improving fundamentals. Companies have come under pressure from regulators to improve overall financial health, leading many to dispose of non-core businesses. Against this backdrop, some investors worry that Japan’s central bank may have tightened policy too soon.
The Magnificent Seven stocks consist of Alphabet, Amazon, Apple, Meta, Microsoft, NVIDIA and Tesla.
MSCI Europe Index is designed to measure developed equity market results across 15 developed countries in Europe.
MSCI Japan Index is a free float-adjusted market capitalization-weighted index designed to measure the equity market results of Japan.
MSCI USA Index is a free float-adjusted, market capitalization-weighted index designed to measure the equity market results in the United States.
The MSCI USA Momentum Index is based on the MSCI USA Index, its parent index, which captures large- and mid-cap stocks of the U.S. market. It is designed to reflect the performance of an equity momentum strategy by emphasizing stocks with high price momentum, while maintaining reasonably high trading liquidity, investment capacity and moderate index turnover.
The MSCI USA Quality Index is based on the MSCI USA Index, its parent index, which includes large- and mid-cap stocks in the U.S. equity market. The index aims to capture the performance of quality growth stocks by identifying stocks with high quality scores based on three main fundamental variables: high return on equity (ROE), stable year-over-year earnings growth and low financial leverage.
The MSCI USA Size Tilt Index is based on the MSCI USA Index, its parent index, which includes large- and mid-cap stocks of the U.S. equity markets. The index reflects the performance of a low size strategy with relatively high investment capacity. The indexes are created by including all the constituents in the parent index and weighting the constituents using the square root of their market capitalization weight.
The MSCI USA Value Weighted Index is based on the MSCI USA Index, which includes U.S. large- and mid-cap stocks. The MSCI USA Value Weighted Index reweights each security of the parent index to emphasize stocks with lower valuations. Index weights are determined using fundamental accounting data — sales, book value, earnings and cash earnings — rather than market prices.
S&P 500 Index is a market capitalization-weighted index based on the results of approximately 500 widely held common stocks.
For full disclosures go to capitalgroup.com/global-disclosures.
Our latest insights
-
-
Market Volatility
-
-
-
U.S. Equities
Commissions, trailing commissions, management fees and expenses all may be associated with investments in investment funds. Please read the prospectus before investing. Investment funds are not guaranteed or covered by the Canada Deposit Insurance Corporation or by any other government deposit insurer. For investment funds other than money market funds, their values change frequently. For money market funds, there can be no assurances that the fund will be able to maintain its net asset value per security at a constant amount or that the full amount of your investment in the fund will be returned to you. Past performance may not be repeated.
Unless otherwise indicated, the investment professionals featured do not manage Capital Group‘s Canadian investment funds.
References to particular companies or securities, if any, are included for informational or illustrative purposes only and should not be considered as an endorsement by Capital Group. Views expressed regarding a particular company, security, industry or market sector should not be considered an indication of trading intent of any investment funds or current holdings of any investment funds. These views should not be considered as investment advice nor should they be considered a recommendation to buy or sell.
Statements attributed to an individual represent the opinions of that individual as of the date published and do not necessarily reflect the opinions of Capital Group or its affiliates. This information is intended to highlight issues and not be comprehensive or to provide advice. For informational purposes only; not intended to provide tax, legal or financial advice. Capital Group funds are available in Canada through registered dealers. For more information, please consult your financial and tax advisors for your individual situation.
Forward-looking statements are not guarantees of future performance, and actual events and results could differ materially from those expressed or implied in any forward-looking statements made herein. We encourage you to consider these and other factors carefully before making any investment decisions and we urge you to avoid placing undue reliance on forward-looking statements.
The S&P 500 Composite Index (“Index”) is a product of S&P Dow Jones Indices LLC and/or its affiliates and has been licensed for use by Capital Group. Copyright © 2025 S&P Dow Jones Indices LLC, a division of S&P Global, and/or its affiliates. All rights reserved. Redistribution or reproduction in whole or in part are prohibited without written permission of S&P Dow Jones Indices LLC.
FTSE source: London Stock Exchange Group plc and its group undertakings (collectively, the "LSE Group"). © LSE Group 2025. FTSE Russell is a trading name of certain of the LSE Group companies. "FTSE®" is a trade mark of the relevant LSE Group companies and is used by any other LSE Group company under licence. All rights in the FTSE Russell indices or data vest in the relevant LSE Group company which owns the index or the data. Neither LSE Group nor its licensors accept any liability for any errors or omissions in the indices or data and no party may rely on any indices or data contained in this communication. No further distribution of data from the LSE Group is permitted without the relevant LSE Group company's express written consent. The LSE Group does not promote, sponsor or endorse the content of this communication. The index is unmanaged and cannot be invested in directly.
BLOOMBERG® is a trademark and service mark of Bloomberg Finance L.P. and its affiliates (collectively “Bloomberg”). Bloomberg or Bloomberg’s licensors own all proprietary rights in the Bloomberg Indices. Neither Bloomberg nor Bloomberg’s licensors approves or endorses this material, or guarantees the accuracy or completeness of any information herein, or makes any warranty, express or implied, as to the results to be obtained therefrom and, to the maximum extent allowed by law, neither shall have any liability or responsibility for injury or damages arising in connection therewith.
MSCI does not approve, review or produce reports published on this site, makes no express or implied warranties or representations and is not liable whatsoever for any data represented. You may not redistribute MSCI data or use it as a basis for other indices or investment products.
Capital believes the software and information from FactSet to be reliable. However, Capital cannot be responsible for inaccuracies, incomplete information or updating of the information furnished by FactSet. The information provided in this report is meant to give you an approximate account of the fund/manager's characteristics for the specified date. This information is not indicative of future Capital investment decisions and is not used as part of our investment decision-making process.
Indices are unmanaged and cannot be invested in directly. Returns represent past performance, are not a guarantee of future performance, and are not indicative of any specific investment.
All Capital Group trademarks are owned by The Capital Group Companies, Inc. or an affiliated company in Canada, the U.S. and other countries. All other company names mentioned are the property of their respective companies.
Capital Group funds are offered in Canada by Capital International Asset Management (Canada), Inc., part of Capital Group, a global investment management firm originating in Los Angeles, California in 1931. Capital Group manages equity assets through three investment groups. These groups make investment and proxy voting decisions independently. Fixed income investment professionals provide fixed income research and investment management across the Capital organization; however, for securities with equity characteristics, they act solely on behalf of one of the three equity investment groups.
The Capital Group funds offered on this website are available only to Canadian residents.