Economic Indicators
 Darrell Spence
 Pramod Atluri
 Brad Freer
The United States, flexing its muscles as the world’s largest economy, is once again serving the critical role of global growth engine. As Europe and China struggle with weak economic activity, the U.S., India and, to a lesser extent, Japan are showing signs of resilience as the major players in the world economy diverge.
Despite higher interest rates and elevated inflation, the International Monetary Fund is predicting the U.S. economy will expand this year at more than twice the rate of other major developed countries. The IMF recently raised its forecast for U.S. growth to 2.7%, compared to 0.8% for Europe. Moreover, the power of America’s consumer-driven economy is helping to support growth in the rest of the world as well.
“People used to say if the U.S. sneezes, the rest of the world catches a cold. The opposite can also be true,” says Capital Group economist Darrell Spence. “When it’s firing on all cylinders, the U.S. can help other export-oriented economies.”
U.S. and India generate strong tailwinds for the global economy

Source: Capital Group. Country positions are forward-looking estimates by Capital Group economists as of April 2024 and include a mix of quantitative and qualitative characteristics. Long-term tailwinds and headwinds are based on structural factors such as debt, demographics and innovation. Near-term tailwinds and headwinds are based on cyclical factors such as labour, housing, spending, investment and financial stability. The size of the bubbles are used to approximate the relative size of each economy (in USD) and are for illustrative purposes only.
Spence is more optimistic than the IMF. He believes the U.S. economy will grow at a rate closer to 3.0% this year as consumers continue to spend, the labour market remains tight, and manufacturers invest in newly diversified supply chains. Meanwhile, recession fears — widespread just a year ago — are no longer a given.
“Most people would have thought that after the Federal Reserve raised interest rates as aggressively as they did, the U.S. would be in the middle of a recession right now,” Spence adds. “It is surprising, to myself included, that we haven't seen more economic weakness.”
Inflation is falling but stalling
Looking ahead, much depends on the path of inflation. The U.S. economy has continued to grow in the face of elevated inflation and a federal funds rate currently at a 23-year high. It now sits in a range of 5.25% to 5.50%, up from near zero roughly two years ago.
“The U.S. economy has adapted well to this new rate environment,” says fixed income portfolio manager Pramod Atluri.
The Fed’s battle against inflation has made significant progress, helping push consumer price increases down from 9.1% in June of 2022, to a range of 3% to 4% over the past few months. However, that is still above the Fed’s goal of 2%, a fact that calls into question whether the central bank will cut rates this year or stand pat. Based on their public comments, Fed officials appear biased toward cutting.
Inflation is declining around the world, but does it justify rate cuts?

Sources: Capital Group, Bloomberg Index Services Ltd., FactSet, International Monetary Fund (IMF). Inflation data as of April 30, 2024, except for Japan data which is as of March 31, 2024. IMF estimates as of April 2024. Policy rates represent the rate on overnight interbank lending. Inflation data is expressed using the Consumer Price Index (CPI), a measure of the average change over time in the prices paid by urban consumers for a market basket of consumer goods and services. Market-implied policy rates are based on contract pricing across futures markets and are as of May 23, 2024.
Fed Chair Jerome Powell has identified two paths to rate cuts: unexpected weakness in the labour market or inflation moving sustainably down to 2%. As Powell often states, Fed policy remains “data dependent.”
Atluri is optimistic that price increases will fall closer to the Fed’s target in the second half of this year. That’s largely because rent increases — a major reason core inflation remains elevated — continue to modestly improve.
Elsewhere in the world, growth and inflation expectations are weaker than in the U.S., and central banks are expected to cut interest rates more rapidly. Europe is struggling with economic growth below 1%. China’s economy, hit by a major downturn in the real estate market, is showing signs of additional weakness as the world’s second largest economy reaches a level of maturity after nearly 30 years of uninterrupted growth.
Emerging markets: India on the rise
In contrast, India has emerged as a bright star in the emerging markets universe. India’s economy is expected to grow at a rate of 6.8% this year, according to IMF projections. And its stock market has provided some of the best returns in the world over the past few years, based on the MSCI India Index.
As the post-pandemic world adopts new and diverse supply chains, many companies are looking to India as an additional source of manufacturing capacity as China’s economy matures. For instance, India has become a viable alternative when it comes to manufacturing mobile phones, home appliances, pharmaceuticals and other products traditionally associated with China’s manufacturing base.
China and India: A tale of two evolving stock markets

Sources: MSCI, RIMES. Data reflects January 31, 2020, to March 31, 2024.
The rise of India also speaks to a larger trend in other emerging markets. Infrastructure growth is accelerating, new manufacturing hubs are boosting regional economies, and the world’s energy transition is driving foreign investment into a broader mix of developing countries.
“The setup for emerging markets is attractive,” says equity portfolio manager Brad Freer. “As multinationals diversify their supply chains, this is an exciting opportunity for countries such as India, Mexico and Indonesia because it broadens the investable options for manufacturers in the U.S. and Europe. Meanwhile, a deep selloff in China has created opportunities to selectively invest in companies with strong cash flows and dominant market share.”
On top of that, most emerging markets are trading at their cheapest valuations on a price-to-earnings basis in 10 years, Freer notes, and central banks in many developing countries have ample room to cut interest rates.
U.S. presidential election: The world is watching
Elections are taking place throughout the world this year, but none will be more closely watched than the November rematch between incumbent U.S. President Joe Biden and former President Donald Trump. The result could produce a significant shift in political leadership, potentially triggering policy changes that could affect the investment environment, both in the U.S. and globally.
A great deal depends on whether the winning presidential candidate will muster enough support to propel other candidates in his party to victory, taking control of the U.S. Senate and the House of Representatives in a red wave or blue wave scenario. Otherwise, gridlock could prevail, with little change expected. However it plays out, investors should expect occasional bouts of market volatility in the months leading up to election day.
How U.S. elections could impact financial markets
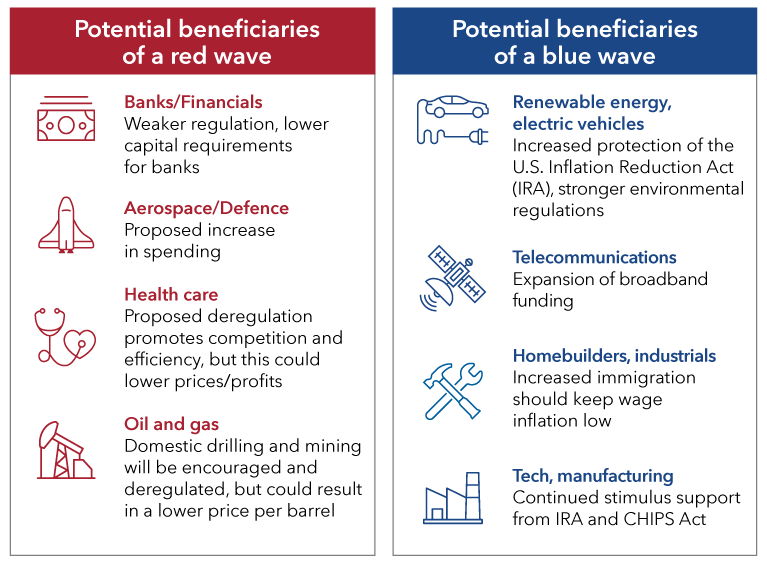
Source: Capital Group. CHIPS Act refers to the Creating Helpful Incentives to Produce Semiconductors Act, passed by U.S. lawmakers in 2022 to encourage domestic manufacturing of computer chips.
A Republican sweep, or red wave, could benefit banks, health care companies, and oil and gas companies, primarily through deregulation, according to Capital Group’s Night Watch team, a group of economists, analysts and portfolio managers who track such issues. A Democratic sweep, or blue wave, could provide a boost to renewable energy initiatives, industrial stimulus spending and telecommunications projects through additional funding for nationwide broadband access.
As for the presidential election, it remains too close to call. “We’re still a few months away,” says Capital Group political economist Matt Miller. “And that’s a lifetime in politics.”
The MSCI Emerging Markets Index is a free float-adjusted, market-capitalization index that measures equity market performance across 24 emerging markets countries.
The MSCI India Index is designed to measure the performance of the large- and mid-cap segments of the Indian market. With 114 constituents, the index covers approximately 85% of the Indian equity universe.
Our latest insights
-
-
Market Volatility
-
-
-
U.S. Equities
Commissions, trailing commissions, management fees and expenses all may be associated with investments in investment funds. Please read the prospectus before investing. Investment funds are not guaranteed or covered by the Canada Deposit Insurance Corporation or by any other government deposit insurer. For investment funds other than money market funds, their values change frequently. For money market funds, there can be no assurances that the fund will be able to maintain its net asset value per security at a constant amount or that the full amount of your investment in the fund will be returned to you. Past performance may not be repeated.
Unless otherwise indicated, the investment professionals featured do not manage Capital Group‘s Canadian investment funds.
References to particular companies or securities, if any, are included for informational or illustrative purposes only and should not be considered as an endorsement by Capital Group. Views expressed regarding a particular company, security, industry or market sector should not be considered an indication of trading intent of any investment funds or current holdings of any investment funds. These views should not be considered as investment advice nor should they be considered a recommendation to buy or sell.
Statements attributed to an individual represent the opinions of that individual as of the date published and do not necessarily reflect the opinions of Capital Group or its affiliates. This information is intended to highlight issues and not be comprehensive or to provide advice. For informational purposes only; not intended to provide tax, legal or financial advice. Capital Group funds are available in Canada through registered dealers. For more information, please consult your financial and tax advisors for your individual situation.
Forward-looking statements are not guarantees of future performance, and actual events and results could differ materially from those expressed or implied in any forward-looking statements made herein. We encourage you to consider these and other factors carefully before making any investment decisions and we urge you to avoid placing undue reliance on forward-looking statements.
The S&P 500 Composite Index (“Index”) is a product of S&P Dow Jones Indices LLC and/or its affiliates and has been licensed for use by Capital Group. Copyright © 2025 S&P Dow Jones Indices LLC, a division of S&P Global, and/or its affiliates. All rights reserved. Redistribution or reproduction in whole or in part are prohibited without written permission of S&P Dow Jones Indices LLC.
FTSE source: London Stock Exchange Group plc and its group undertakings (collectively, the "LSE Group"). © LSE Group 2025. FTSE Russell is a trading name of certain of the LSE Group companies. "FTSE®" is a trade mark of the relevant LSE Group companies and is used by any other LSE Group company under licence. All rights in the FTSE Russell indices or data vest in the relevant LSE Group company which owns the index or the data. Neither LSE Group nor its licensors accept any liability for any errors or omissions in the indices or data and no party may rely on any indices or data contained in this communication. No further distribution of data from the LSE Group is permitted without the relevant LSE Group company's express written consent. The LSE Group does not promote, sponsor or endorse the content of this communication. The index is unmanaged and cannot be invested in directly.
BLOOMBERG® is a trademark and service mark of Bloomberg Finance L.P. and its affiliates (collectively “Bloomberg”). Bloomberg or Bloomberg’s licensors own all proprietary rights in the Bloomberg Indices. Neither Bloomberg nor Bloomberg’s licensors approves or endorses this material, or guarantees the accuracy or completeness of any information herein, or makes any warranty, express or implied, as to the results to be obtained therefrom and, to the maximum extent allowed by law, neither shall have any liability or responsibility for injury or damages arising in connection therewith.
MSCI does not approve, review or produce reports published on this site, makes no express or implied warranties or representations and is not liable whatsoever for any data represented. You may not redistribute MSCI data or use it as a basis for other indices or investment products.
Capital believes the software and information from FactSet to be reliable. However, Capital cannot be responsible for inaccuracies, incomplete information or updating of the information furnished by FactSet. The information provided in this report is meant to give you an approximate account of the fund/manager's characteristics for the specified date. This information is not indicative of future Capital investment decisions and is not used as part of our investment decision-making process.
Indices are unmanaged and cannot be invested in directly. Returns represent past performance, are not a guarantee of future performance, and are not indicative of any specific investment.
All Capital Group trademarks are owned by The Capital Group Companies, Inc. or an affiliated company in Canada, the U.S. and other countries. All other company names mentioned are the property of their respective companies.
Capital Group funds are offered in Canada by Capital International Asset Management (Canada), Inc., part of Capital Group, a global investment management firm originating in Los Angeles, California in 1931. Capital Group manages equity assets through three investment groups. These groups make investment and proxy voting decisions independently. Fixed income investment professionals provide fixed income research and investment management across the Capital organization; however, for securities with equity characteristics, they act solely on behalf of one of the three equity investment groups.
The Capital Group funds offered on this website are available only to Canadian residents.