info
National Day of Mourning, January 9, 2025: the New York Stock Exchange and Capital Group’s U.S. offices will be closed.

In observance of the National Day of Mourning on Thursday, January 9, to honor former President James Earl Carter, Jr., the New York Stock Exchange and Capital Group, home of American Funds, will be closed. Financial transactions, including those placed through the web, will be processed using the closing price of the next date the markets are open.

Bonds

Why the yield curve steepener should have more room to run

After much anticipation, the Federal Reserve kicked off its monetary easing cycle in September with a 50-basis-point reduction of the federal funds rate. Treasury yields rallied ahead of the meeting, ending the prolonged inversion of the yield curve: 10-year yields moved above 2-year yields for the first time since July 2022. 

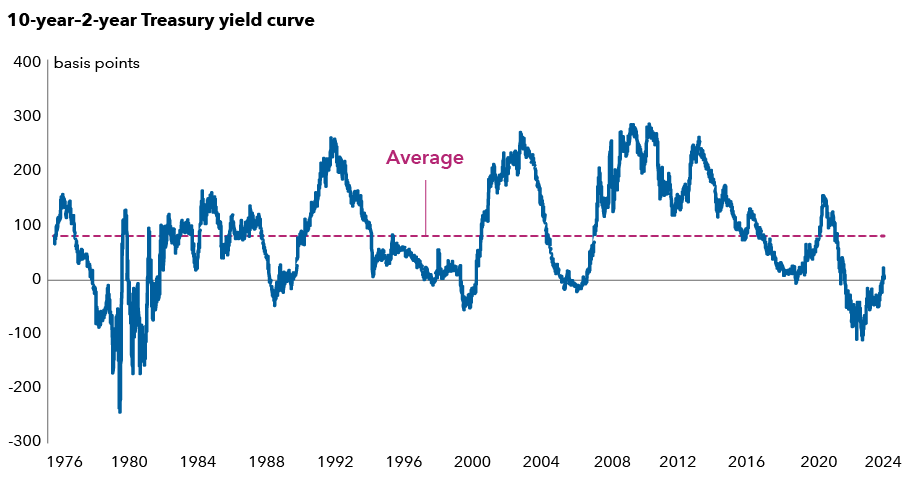
Yield curve remains well below historical average level

Chart shows the difference in yields between 2-year and 10-year U.S. Treasury bonds (yield curve) from 1976 – 2024 and its average level over that period. As of October 10, 2024, the yield curve was back above zero – having previously been inverted since 2021 – but still remains well below its average. The chart shows numerous previous instances where the yield curve inverted (fell below zero) and shows that historically, it has tended to steepen rapidly after re-entering positive territory.

Source: Federal Reserve Bank of St. Louis. Data as of October 10, 2024. The 2s10s Treasury curve represents the 10-year Treasury yield spread over the 2-year Treasury yield. 

Capital Group’s interest rates team has a long-held conviction in a yield curve steepener. This can happen either by short-term yields falling more than long-term yields and/or long-term yields rising more. This should normalize the curve to be upward sloping. Now that the Fed has delivered its first policy rate cut, the team expects the curve could steepen more meaningfully.


The chart above shows the difference between the 10-year yield and 2-year yield remains notably smaller than its 50-year average. In the post-Volcker era, when the curve previously inverted, it has tended to steepen significantly after moving back into positive territory. The interest rate team now favors greater emphasis on steepening in this portion of the curve. 


They also expect yield curve positioning to complement attractive opportunities in sectors, such as corporate and securitized markets. A steepening bias should help hedge several potential adverse economic scenarios for risk assets.


The Fed’s messaging suggests it believes current policy is restrictive, and the rate reduction cycle is just beginning. A significant decline in inflation, from over 9% in mid-2022 to 2.5% in August, has given the Fed additional capacity to ease policy rates. Valuations also indicate further curve steepening potential beyond what is priced in by markets.


A more pronounced slowdown in economic growth or deterioration in the labor market could drive the front-end of the yield curve lower. Meanwhile, the resilience of the U.S. economy makes a hard landing or recession scenario less likely, but the risk may be underestimated by markets. Weakness in the economy or a sustained rise in unemployment could trigger a larger than expected Fed response, leading to a greater steepening of the curve.


Additionally, concerns about the high U.S. fiscal deficit and higher supply of Treasuries could resurface and put upward pressure on long-end yields, especially as investors demand higher term premiums. With the deficit at high levels for a non-recessionary environment, there’s potential for further steepening, even with resilient economic growth.

AOLS

Anmol Sinha is a fixed income investment director with 16 years of investment industry experience (as of 12/31/2023). He holds an MBA from Columbia, a master's degree in economics from New York University and a bachelor's degree in economics from University of California, Berkeley.

The Volcker Shock — A period of historically high interest rates, ignited by Federal Reserve Chair Paul Volcker's choice to raise the central bank's key interest rate to curb inflation. Volcker served as Fed chair from 1979 to 1987.


A yield curve illustrates the yields on similar bonds across various maturities. An inverted yield curve occurs when yields on short-term bonds are higher than yields on long-term bonds. Yield curve steepening occurs when long-term rates rise more than short-term rates, or short-term rates fall more than long-term rates.

Investments are not FDIC-insured, nor are they deposits of or guaranteed by a bank or any other entity, so they may lose value.
Investors should carefully consider investment objectives, risks, charges and expenses. This and other important information is contained in the fund prospectuses and summary prospectuses, which can be obtained from a financial professional and should be read carefully before investing.
Statements attributed to an individual represent the opinions of that individual as of the date published and do not necessarily reflect the opinions of Capital Group or its affiliates. This information is intended to highlight issues and should not be considered advice, an endorsement or a recommendation.
All Capital Group trademarks mentioned are owned by The Capital Group Companies, Inc., an affiliated company or fund. All other company and product names mentioned are the property of their respective companies.
Use of this website is intended for U.S. residents only. Use of this website and materials is also subject to approval by your home office.
Capital Client Group, Inc.
This content, developed by Capital Group, home of American Funds, should not be used as a primary basis for investment decisions and is not intended to serve as impartial investment or fiduciary advice.