info
On Christmas Day, the New York Stock Exchange and Capital Group’s U.S. offices will be closed.

In observance of the Christmas Day federal holiday, the New York Stock Exchange and Capital Group’s U.S. offices will close early on Tuesday, December 24 and will be closed on Wednesday, December 25. On December 24, the New York Stock Exchange (NYSE) will close at 1 p.m. (ET) and our service centers will close at 2 p.m. (ET)

India

Will India be the breakout emerging market this decade?

India is known as the market that has confounded optimists and pessimists alike. Could this be its decade to shine?


India's significance as a rising global power came to light with Prime Minister Narendra Modi's recent visit to the United States, where he addressed Congress, met with high-profile business leaders and dined at the White House. From our recent travels around the country, we believe indications are pointing in the right direction: Corporate confidence is high, the economy is expanding at a decent clip and technological innovation is leading to new areas of growth.


For a democracy of its size, the country has seen relative political stability over the past 10 years, allowing economic development to be a top priority. While political instability and market volatility may increase in advance of general elections next year, we believe that India is poised for a period of secular growth, fueled by significant expansion in direct and fixed asset investment. Here are some of the key aspects that make India appealing compared with other emerging markets.

1. Reforms have set the stage for growth


Since Prime Minister Narendra Modi took office in 2014, he and his team have helped usher in pro-business reforms that have accelerated growth by facilitating the expansion of credit and bringing large swaths of the economy into the formal sector.
 

  • Aadhaar — a voluntary biometric identification system similar to the social security number in the U.S. — has brought more than a billion people into a national database. The Aadhaar program, along with the development of credit rating agencies, has helped boost consumer lending.
 
  • A national goods and services tax (GST) implemented in 2017 has replaced an inefficient web of state taxes. As a digitalized system that can also track goods and services at each point in the supply chain, GST has brought the manufacturing and industrial sectors into the formal economy.
 
  • Launched in 2016, Unified Payments Interface (UPI) created an instant real-time payment system. UPI allows non-banks as well as banks to facilitate electronic transactions and provide credit.

Key reforms under Modi

Table shows key events since India's Prime Minister Narendra Modi was elected in May 2014. In September 2014, Make in India campaign starts. In July 2015, "Digital India" initiative unveiled. In March 2016, the Real Estate (Regulation and Development) Act is enacted. In April 2016, the national digital payments system known as UPI launches. In May 2016, India's parliament approves The Insolvency and Bankruptcy Code Act. In July 2017, a nationwide tax system called GST goes into effect. In March 2020, a production-linked incentive program kicks off to boost manufacturing. In September 2020, four labor codes enacted to simplify labor laws.

Sources: Indian government, media reports.

Together, these reforms have revolutionized credit underwriting and sped up the lending process. This should boost the economy and meaningfully expand the market for banks and non-bank financial companies.


Production-linked incentive programs designed to elevate India's domestic manufacturing base are gaining traction too. Modi, while still controversial on some social and human rights issues, has delivered in terms of governance, infrastructure and economic programs. India is projected to become the world's third-largest economy behind the United States and China by 2027, according to the International Monetary Fund. It's currently the fifth largest, after Japan and Germany.1

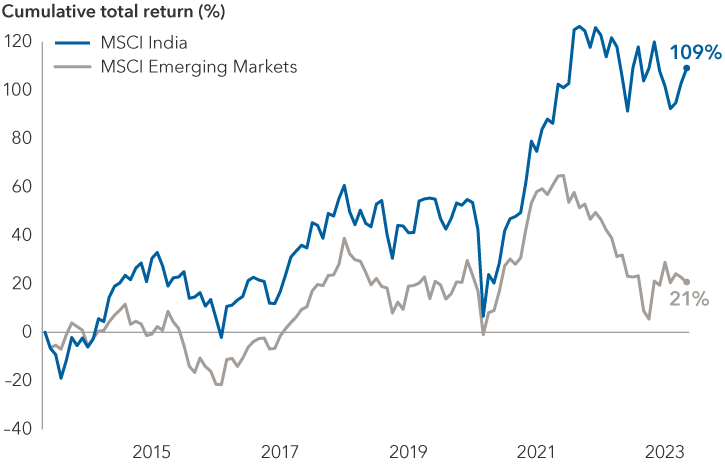
Reforms have helped bolster Indian stocks

Stock chart compares return of MSCI India Index versus the MSCI Emerging Markets Index over a 10-year period. The MSCI India Index produced a cumulative total return of 109% from May 31, 2013, to May 31, 2023. By comparison, the MSCI Emerging Market Index returned 21%.

Sources: MSCI, RIMES. Data as of May 31, 2023.

2. The infrastructure boom is real


The lack of infrastructure has been a major impediment to unlocking India's true growth potential. Over the past five years, the government has pumped billions into building out roads, railroads, airports and seaports. On our recent research trip to meet with companies, it was very clear that the construction of infrastructure as well as more affordable housing is finally happening. We traveled by car from Surat to Mumbai, a distance of 170 miles. Ten years ago, that trip would have taken 12 hours. We did it in six, driving on six-lane highways and stopping at several quality food establishments along the way. That was unheard of just a decade earlier.


In Mumbai, the skyline is unrecognizable from 15 years ago. Dozens of buildings reach 50 or more floors, and a subway system is under construction. Residential housing is fast expanding. As an example, the town of Palava, 20 miles from Mumbai’s central business district, is a master-planned community that reminds us of what we used to see in China. In 15 years, Palava has gone from a concept to a city of 120,000 residents.

3. Tailwinds for manufacturing are getting stronger


The playbook for the Indian government is twofold: ramp up capacity to serve the domestic population and over time become a larger player in export markets. Leaders also want to develop a supply chain ecosystem, as a wide array of product components are imported.


Manufacturing capacity is expanding for mobile phones, home appliances, computers and telecommunications equipment. Modi’s team has been aggressive in courting Japanese, Taiwanese and U.S. companies to invest in new capacity. Apple is producing its iPhone 14 line in India, while Japanese companies Daikin and Mitsubishi Electric are teeing up investments to make air conditioners and related parts.


Local firms have been investing heavily to scale up businesses and tap into the rapidly growing domestic market. These include Amber, a leading maker of air conditioners; Dixon, one of the largest electronics manufacturers; and Havells, an electrical equipment company.


Overall, manufacturing is getting easier. Securing government approvals for land is less onerous, labor is affordable and industrial parks are creating dedicated power sources (consistent power availability has historically been a big challenge).


We anticipate India will become a desirable location for companies looking to diversify their supply chains outside of China, a strategy commonly known as China plus one. That said, it likely has many years to go before it can challenge China as a global manufacturing powerhouse. On the flip side, the upside looks promising.

India trails China in supply chain infrastructure

Table compares infrastructure stats on India and China. India had a gross domestic product per capita of 2,257 dollars, compared with 12,556 dollars for China. India had more than 4,000 industrial parks, compared with more than 2,500 for China. Highway length in India was 146,000 kilometers compared with 169,100 in China. Length of rails in India ran 68,200 kilometers compared with 155,000 in China. India had 13 major ports compared with 34 in China. India had 153 airports compared with 248 in China.

Sources: Capital Group, WorldData, World Bank, Statista, news articles. Data as of 2021.

4. India's equity market has been growing and should evolve


Within the MSCI Emerging Markets Index, India represents 14% of the composite index, behind China at 29% and Taiwan at 16%.2 We expect potential investment opportunities to increase, especially in the small-cap space given India's economic trajectory.


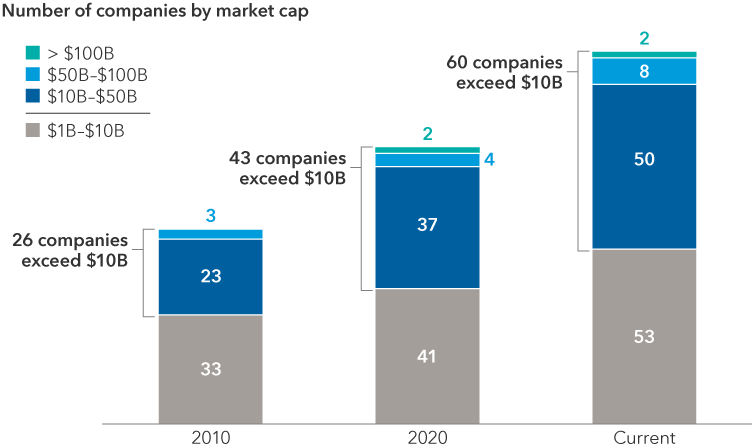
The equity market is still relatively small compared with the size of the economy and its potential growth. The MSCI India Index had a market capitalization of close to $1 trillion as of May 31, 2023. Smaller companies, or those with a market value between $1 billion to $10 billion, made up nearly half the index.

India's equity market is expanding in the small- and mid-cap space

Chart breaks down companies in the MSCI India Index by market value. The number of companies whose market value was between $1 billion and $10 billion rose from 33 in 2010 to 41, as of May 29, 2020, to 53 as of May 29, 2023. The number of companies whose market value was between $10 billion and $50 billion rose from 23 in 2010 to 37 as of May 29, 2020, to 50 as of May 29, 2023. The number of companies whose market value was between $50 billion and $100 billion rose from 3 in 2010 to 4 as of May 29, 2020, to 8 as of May 29, 2023. There no companies whose market value exceeded $100 billion as of May 29, 2010. There were two companies whose market value exceeded $100 billion as of May 29, 2020, and as of May 29, 2023.

Sources: Capital Group, MSCI, RIMES. Data represents MSCI India Index. As of May 29, 2023.

The country’s capital markets have seen a proliferation of initial public offerings (IPOs) in recent years. The types of companies going public — and those in the IPO pipeline — reflect its ongoing transformation. These include online platforms such as Paytm (payments), Zomato (food delivery services) and Policybazaar (insurance quote aggregator). Venture capital has been pouring into the country. India is now behind only the U.S and China in terms of the number of unicorns (unlisted companies valued at $1 billion) as of December 2022.

5. Investment opportunities span real estate, financials and industrials


Real estate: India, which the U.N. projected in April will overtake China as the world's most populous country this year, is a massively underhoused society. Housing is expected to be a key driver — and beneficiary — of the economy's growth. Real estate is projected to rise to nearly 15% of India's gross domestic product (GDP) by fiscal year 2031, up from 7% currently. With that will likely come demand for building materials, cable, refrigerators and air conditioners.


The sector is undergoing a dramatic structural shift, which should boost profits. Government policies have helped reform corrupt practices and build trust in the homebuying process among consumers. A liquidity crisis several years ago also wiped out many smaller developers. Taken together, a once highly fragmented market has become more organized and consolidated.


This should create opportunities for larger regional developers to take market share, especially those building homes and apartments for first-time buyers.


Banks: The overall environment looks positive. Loan growth remains solid in both the retail and corporate categories, and the credit environment remains benign. We could be entering a favorable cycle for banks given the trajectory of the economy and several rounds of consolidation among weaker state-owned banks in recent years.


Valuations for the largest private sector banks appear reasonable relative to history. For example, on a price-to-earnings basis, HDFC Bank is trading at 18 times earnings for the next 12 months, compared with its five-year average of 21 times. On a comparable basis, Kotak Mahindra Bank is trading at 29 times versus its five-year average of 40 times, according to FactSet (as of June 23). 


Markets have been concerned that net interest margins3 — a key profit measure — have peaked, as monetary authorities are expected to cut benchmark interest rates. The flip side is that lower rates should spur the economy. We believe there is sufficient potential for loan growth to offset margin compression given the expansion of credit and robust economic growth.

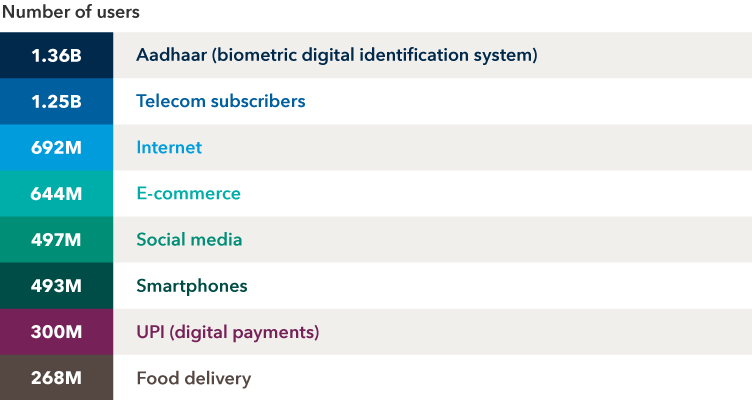
A closer look at India's digital transformation

Graphic shows elements of India's digital transformation and number of users as of February 2023. Aadhaar, a biometric digital identification system, had more than 1.3 billion users. Telecom subscribers were more than 1.2 billion. Active internet users were 692 million. Users of e-commerce platforms totaled 644 million. Users of social media platforms totaled 497 million. Smartphone users were 493 million. UPI, the digital payments platform, had 300 million users. Users of food delivery platforms were 268 million.

Source: Indian Council for Research on International Economic Relations, "State of India’s Digital Economy Report 2023." Data as of February 2023.

Non-bank financial companies: As mentioned, the market has consolidated following a liquidity crisis several years ago, making it much more attractive from an investment perspective. Data gathering through the country's technology infrastructure has helped to improve underwriting standards. This has the potential to be a large market, especially in areas of affordable housing and vehicles. 


Mobile communications: The telecommunications market has consolidated, effectively leaving conglomerate Reliance Industries and Bharti Airtel as the dominant players. We anticipate smartphone and data usage will continue to increase, especially as 5G and fiber-to-the-home technologies are rolled out in more cities.


Reliance, in particular, has witnessed rapid growth, underscoring the pace of India's digital revolution. Since its Jio telecom service was launched in 2016, it has amassed 439 million subscribers and handles 60% of the broadband data traffic.4 India is currently the world's second-largest telecom market by subscribers, making it an attractive proposition for global technology giants. In 2022, Google made a $1 billion investment in Airtel to make smartphones more affordable.

6. China plus one: The chemicals industry sets a good example


The chemicals industry exemplifies how both governments and multinationals are turning to India to diversify manufacturing beyond China. Many chemical companies have come up over the past decade as the West sought to diversify its sourcing of both specialty and generic chemicals.


India’s competitive advantage has been its large pool of trained scientists and chemical engineers, which has enabled it to establish expertise in specialty and commoditized chemicals. This includes those being used in semiconductors, electric vehicle batteries and solar panels, where additional capacity is being built.


That said, India’s chemicals industry is a fraction of that of China, the world's largest producer. But if 10% of demand sourced from China came to India, it would be meaningful. To make a broader point, India is a $3.5 trillion economy, compared with an annual gross domestic product output of $18.1 trillion for China,5 leaving a long runway for growth ahead.

7. The energy transition could be transformational


Indian corporations are seeking to compete with China all along the value chain of clean energy, especially with green hydrogen. So far, the companies looking to capitalize on this effort include Reliance Industries, Larsen & Toubro and Tata Power, based on our conversations with government and industry sources.


The energy transition is potentially transformational for India. If done right, the payoff could be massive: The country is a large importer of oil and gas, so more renewable power would make it more energy independent. It would also significantly boost its manufacturing base.


India's ambition in this area is in the early stages. Specifically, India must build its renewables supply chain from scratch, establish global cost competitiveness, continue to push policy forward and attract a lot of capital. While this will take time, both government and the private sector seem highly motivated.

8. Demographics are the biggest advantage


While India will very likely benefit from Western countries exploring China-plus sourcing strategies, the bulk of economic growth will come from domestic consumption and investment. With a median age of 29 years, India in our view has one of the most attractive demographic profiles among the world’s largest economies and can reap benefits from its productive capacity, provided the right policies are in place.


We have already seen that technological innovation combined with an improving regulatory and legal framework has put the nation's economy on a path of 5% to 6% annualized growth, among the fastest of the world's large economies. With a general election due in 2024, political risk will rise. The consensus view in markets today is that the pro-business Modi government will retain power, possibly with a reduced majority in parliament.


Should that change, market volatility will no doubt increase. But the imperative of economic growth and job creation is well understood by political parties across the ideological spectrum.

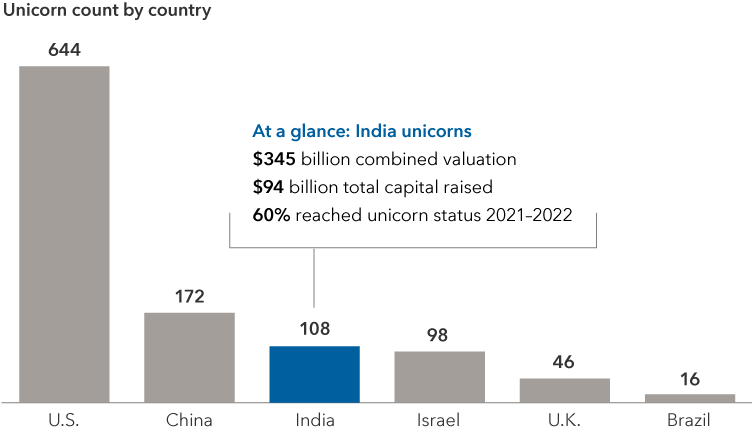
India has emerged on the global unicorn stage

Chart shows number of unicorns by country as of December 2022. The U.S. had 644. China had 172. India had 108. Israel had 98. The U.K. had 46. Brazil had 16. Indian unicorns in particular had a $345 billion combined valuation and $94 billion total capital raised. 60 percent of Indian unicorns reached unicorn status from 2021 to 2022. Top Indian unicorns by value are BYJU’S (ed tech) and Swiggy (food delivery).

Sources: Inc42 (for Indian unicorns), TechAviv (for Israeli unicorns) and CB Insights (for all others). Unicorn refers to a startup valued at or above $1 billion. Data as of December 2022.

9. Valuations are stretched but not insurmountable


When it comes to investing in emerging markets, India has historically traded at a premium on a relative price-to-earnings basis. Currently, the market looks a little expensive by historical standards. The MSCI India Index trades at 20 times forward earnings versus its 10-year average of 18 times.6


That said, we believe the fundamental outlook for India is arguably better than ever. The market has a lot going for it: It's one of the world's fastest growing economies, inflation is under control, the government has been fiscally responsible, and corruption is lower than it was a decade ago. If Indian companies can deliver on earnings and cash flows, we think it's possible the market can grow into these valuations.


The path of India’s equities has never been a straight line, but over longer periods, the stock market has delivered some of the best returns among emerging and developed markets.

India's equity benchmark has delivered over the past 20 years

Table compares the annualized total returns of global benchmarks on a five-, 10- and 20-year basis. Data as of May 31, 2023. The MSCI India Index returned 13 percent over 20 years and nearly 7.6 percent for both the 10- and five-year periods. The MSCI Emerging Markets Index returned 8.3 percent over 20 years, 1.9 percent for 10 years and lost nearly 0.7 percent for the five years. The MSCI ACWI returned 8 percent for the 20 years, 7.8 percent for the 10 years and 6.8 percent for the 5 years. The S&P 500 returned 9.1 percent for the 20 years, 11.4 percent for the 10 years and 10.4 percent for the five years.

Sources: MSCI, RIMES. Data as of May 31, 2023.

brad-freer-color-600x600-new

Brad Freer is an equity portfolio manager with 33 years of investment industry experience (as of 12/31/2023). He holds a bachelor’s degree in international relations from Connecticut College and is a CFA® charterholder.

shlok-melwani-color-600x600

Shlok Melwani is an equity portfolio manager with 19 years of industry experience (as of 12/31/2023). As an analyst, he covers Europe and India as a small- and mid-cap generalist. He holds an MBA from London Business School and a bachelor’s degree in economics from Cornell University.

headshot-Anirudha-Dutta-AZD-600x600

Anirudha Dutta is an India macro analyst with 28 years of investment industry experience (as of 12/31/2023). He holds a postgraduate diploma in business management from the Xavier School of Management and a bachelor’s degree with honors in metallurgical engineering from the Indian Institute of Technology, Kharagpur.

sadiwala-rahul-color-600x600

Rahul Sadiwala is an equity investment analyst with 16 years of industry experience (as of 12/31/2022). He covers Asia-Pacific financials and fintech and India as a generalist. He holds an MBA from Wharton and a bachelor’s degree in business administration from Washington University in St. Louis. He also holds the Chartered Financial Analyst® designation. 

Investing in developing markets may be subject to additional risks, such as significant currency and price fluctuations, political instability, differing securities regulations and periods of illiquidity, which are detailed in the fund's prospectus. Investments in developing markets have been more volatile than investments in developed markets, reflecting the greater uncertainties of investing in less established economies. Individuals investing in developing markets should have a long-term perspective and be able to tolerate potentially sharp declines in the value of their investments.


The indexes are unmanaged and, therefore, have no expenses. Investors cannot invest directly in an index.


Small-company stocks entail additional risks, and they can fluctuate in price more than larger company stocks.


MSCI All Country World Index is a free float-adjusted market capitalization weighted index that is designed to measure equity market results in the global developed and emerging markets, consisting of more than 40 developed and emerging market country indexes.


The MSCI India Index is designed to measure the performance of the large and mid-cap segments of the Indian market. With 114 constituents, the index covers approximately 85% of the Indian equity universe.


MSCI Emerging Markets Index is a free float-adjusted market capitalization weighted index that is designed to measure equity market results in the global emerging markets, consisting of more than 20 emerging market country indexes.


S&P 500 Index is a market-capitalization-weighted index based on the results of 500 widely held common stocks.


Each S&P Index ("Index") shown is a product of S&P Dow Jones Indices LLC and/or its affiliates and has been licensed for use by Capital Group. Copyright © 2023 S&P Dow Jones Indices LLC, a division of S&P Global, and/or its affiliates. All rights reserved. Redistribution or reproduction in whole or in part is prohibited without written permission of S&P Dow Jones Indices LLC.


1 All figures as of April 2023. Source: IMF. 

2 As of May 31, 2023. Source: MSCI.

3 Net interest margin reveals how much the bank is earning in interest on its loans compared to how much it is paying out in interest on deposits.

4 As of March 31, 2023. Source: Reliance Industries.

5 As of April 2023. Source: IMF.

6 As of May 31, 2023. Sources: MSCI, RIMES.

Investments are not FDIC-insured, nor are they deposits of or guaranteed by a bank or any other entity, so they may lose value.
Investors should carefully consider investment objectives, risks, charges and expenses. This and other important information is contained in the fund prospectuses and summary prospectuses, which can be obtained from a financial professional and should be read carefully before investing.
There have been periods when the results lagged the index(es) and/or average(s). The indexes are unmanaged and, therefore, have no expenses. Investors cannot invest directly in an index.
MSCI has not approved, reviewed or produced this report, makes no express or implied warranties or representations and is not liable whatsoever for any data in the report. You may not redistribute the MSCI data or use it as a basis for other indices or investment products.
Statements attributed to an individual represent the opinions of that individual as of the date published and do not necessarily reflect the opinions of Capital Group or its affiliates. This information is intended to highlight issues and should not be considered advice, an endorsement or a recommendation.
All Capital Group trademarks mentioned are owned by The Capital Group Companies, Inc., an affiliated company or fund. All other company and product names mentioned are the property of their respective companies.
Use of this website is intended for U.S. residents only. Use of this website and materials is also subject to approval by your home office.
Capital Client Group, Inc.
This content, developed by Capital Group, home of American Funds, should not be used as a primary basis for investment decisions and is not intended to serve as impartial investment or fiduciary advice.