United States

U.S. public debt: Where is the breaking point?

The sustainability of U.S. public debt has reappeared as a key financial risk to investors. After all, U.S. Treasuries are the safe-haven asset against which most financial assets are priced and benchmarked. But what if U.S. public debt rises to riskier levels, and what are the factors or scenarios that would lead to that? In this article, we examine how likely these scenarios are and what the implications could be for financial assets.


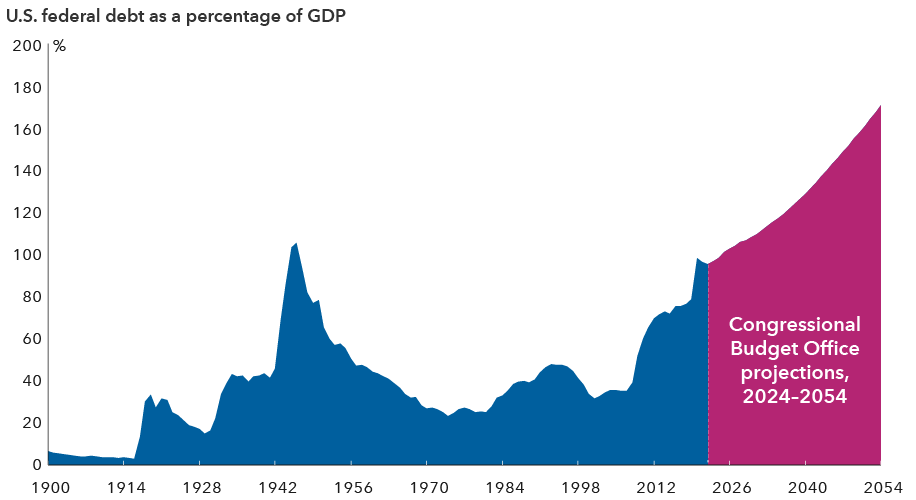
First the basics: U.S. debt has risen from around 60% of gross domestic product during the global financial crisis to roughly 120% of GDP today — $35 trillion and rising. While it’s impossible to quantify where a limit is in terms of where debt becomes explosive, some of the most commonly used forecasts today, including the Congressional Budget Office (CBO), show debt soaring well into the future. 

U.S. government debt is expected to mount

A line chart represents the U.S. federal debt as a percentage of GDP from 1900 to 2054. The x-axis marks the years, while the y-axis shows the percentage, ranging from zero to 200 percent. From 1900 to 2022, the debt percentage fluctuates, with notable peaks and troughs that correspond to historical events. Debt rises to 30% of GDP after the stock market crash of 1929 and grows during the Great Depression. The federal debt spikes to 106% of GDP by 1946 and declines in the post-World War II period until the 1980s, when it rises again. The chart highlights projections from 2024 to 2054, which indicate a steady upward trend, reflecting an increasing federal debt burden relative to the nation's economic output. The Congressional Budget Office projections for this period are included to illustrate future financial forecasts based on current trends and policies.

Source: Congressional Budget Office February 2024 report. 

How accurate are debt projections? 

Projections are just that and predicting the path of the U.S. debt is highly dependent on several factors. Small changes to several assumptions can significantly change the trajectory of the debt. These projections also tend to extrapolate current trends, as the CBO must assume no legislative changes when making its forecasts.


Projections for debt levels are also very sensitive to the macro assumptions used, even if you leave the path of taxing and spending unchanged. In particular, the difference between real interest rates and GDP growth plays a key role in determining the trajectory of the debt-to-GDP ratio. The CBO currently assumes that long-term real interest rates will be approximately 2% in the future, which is a bit above historical averages and slightly below historical experience for GDP, which implies worsening debt dynamics. Changing those assumptions even modestly can have a significant impact, producing very different outcomes.


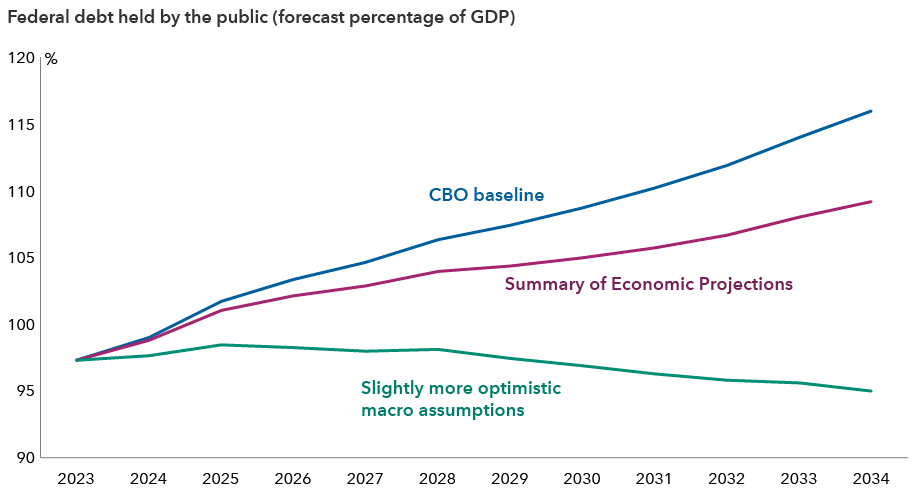
For example, the Fed thinks rates will settle at a slightly lower rate versus the CBO. The June 2024 Fed dot plot implicitly estimates future short real rates of approximately 0.8%. Adding that single change to the CBO forecast eliminates roughly one-third of the expected rise in debt. Further, marginally more optimistic macro assumptions, such as increasing productivity 50 bps to 1.6%, and a slightly higher path of inflation at 2.5% compared to the CBO’s assumptions of 2%, deliver a projection of U.S. public debt actually decreasing over time.


The reverse applies as well, of course: If you assume a more negative outlook for the U.S. economy the picture looks worse than in the baseline. But that also goes to show how inherently sensitive these forecasts are. The path of debt that they imply is far from set in stone.

Federal debt could drop in an optimistic scenario

The line chart depicts three different scenarios for federal debt held by the public as a percentage of GDP from 2023-2034. The top line is the CBO February baseline projection, which is the steepest upward increasing line, followed by the Fed dot plot scenario in the middle line, which steadily increases over time. The bottom line is Capital Group’s slightly more optimistic macro assumptions, which slightly decrease over time. Note: The top line assumes that the 10-year Treasury yield is at the Fed's terminal dot plot plus a 50-basis point term premium. The bottom line assumes a slightly higher path for inflation and productivity than the CBO and a flat 4% path for 10-year yields.

Sources: Capital Group, CBO, Federal Reserve. Data as of February 24, 2024. 

What’s behind the recent debt increase?

It’s useful to scan the history of public debt. U.S. debt projections have changed significantly over time, demonstrating again how important the overall macro assumptions are to these models.


Around the turn of the century, the worry among policymakers and economists was that U.S. Treasuries as an asset class would soon be eliminated, as there would simply be no more public debt outstanding. In 2000, the CBO was expecting a continuation of the Clinton era-surpluses which would result in the virtual elimination of the debt stock by 2010.


In fact, in late 2000, President Clinton announced that the U.S. was on course to eliminate debt within the next decade. This constrained the supply of safe liquid assets for investors to buy and raised concerns over the proper functioning of financial markets. Fast forward just a few years, and the worry had flipped completely from too little debt to too much.

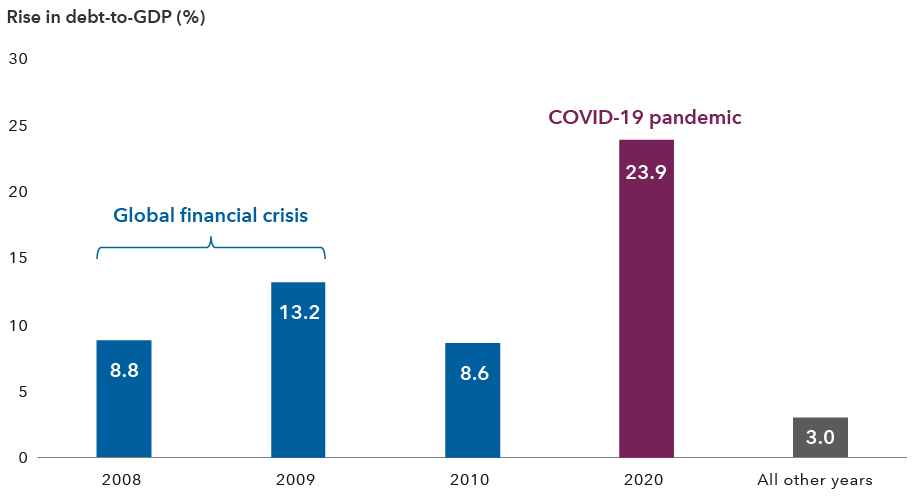
Turning to today, the common view on U.S. fiscal policy is that spending is skyrocketing, contributing to an ever-rising debt burden. While the broad story of rising debt is true, and in general the pace of spending is higher than revenues, the increase in the debt burden almost entirely occurred during the two massive shocks of the global financial crisis (GFC) and the COVID-19 pandemic. Excluding those two periods, the debt is broadly flat since 2007.


While that doesn’t paint the whole story, and it doesn’t make the debt sustainable, it does show just how detrimental these two major episodes were to the public finances, rather than a simple case of routine fiscal spending. 

Financial crisis and COVID-19 caused debt-to-GDP to soar

The bar chart shows rising levels of the percentage of debt-to-GDP during periods of high debt growth. The bars on the left side show 2008 at 8.8%, 2009 at 13.2%, representing the global financial crisis, and 2010 at 8.6%. A bar for 2020 represents the COVID-19 pandemic at 23.9%, followed by all other years at 3.0%.

Sources: Capital Group, CBO, IMF. As of December 23, 2023. All other years refer to 2011 through 2023, excluding 2020. 

Will rising term premia worsen the debt burden? 

Fiscal risks aren’t always overblown, nor is the room to run deficits endless. Term premia (the additional return investors expect for holding longer dated instruments) is currently quite low and has been low for a long time. A sudden loss of appetite for Treasuries could indeed lead to a spike in term premia, but this is more likely to be driven by macroeconomic changes rather than debt sustainability fears. Previous episodes of term premium spikes, such as those in the 1970s and briefly following the COVID-19 pandemic, have centered more on inflation risk.


Term premia may rise, but U.S. Treasuries are likely to continue being priced as a rates instrument rather than a credit instrument, even if the debt-to-GDP ratio rises modestly.  At these high debt levels, a sudden increase in term premia could significantly impact debt service costs, adding to the fiscal burden.


Furthermore, about 20% of U.S. debt, $7.16 trillion as of September 30, 2024, is intragovernmental debt, which has fewer economic consequences than debt owed to other investors, who may require higher interest rates in the future.


Does that mean that there’s no need to worry? Not exactly. The overwhelming majority of economists agree that deficits are currently too high, and the government will need to reduce them at some point.


A further rise in deficits from current levels that is not accompanied by economic growth or inflation would lead to a deterioration in so-called “r-g” dynamics, which can quickly escalate at high debt levels. (The r-g concept compares the real interest rate, r, to the real economic growth rate, g. Debt is more manageable if growth outpaces borrowing costs, but problematic in the inverse.) Another real worry is a loss of faith in institutions or concerns that policy action will not be timely or adequate.


While these scenarios should not be ruled out, for now, they are lower probability events, and in the absence of additional unexpected shocks, term premium levels are likely to remain low or see a moderate rise.

Is the U.S. headed for a debt crisis? 

The U.S. government’s ability to issue debt exclusively in its own currency and see predictable demand from investors provides a unique level of flexibility. A common feature of countries that experience a sovereign debt crisis is that they have borrowed in foreign currencies, creating a vulnerability when their own currency depreciates or economic conditions worsen, and debt repayment ability is reduced.


Despite high debt levels, a U.S. credit event seems very unlikely, and while the debt situation is concerning, it isn’t necessarily catastrophic. The specific threshold or timing where debt/GDP ratios become unmanageable in the U.S. depends on many factors. The demand for Treasuries as the predominant safe asset of the world also means that debt-to-GDP paints a very partial picture.


One reason why we may be less likely to see a mass flight from Treasuries due to solvency concerns is simply the lack of clear alternatives. Outside of Treasuries, the investable universe of large, liquid, relatively safe and convertible debt is very small. For comparison, $35 trillion of U.S. Treasuries is roughly equivalent to the entire stock of the rest of the G-7 countries and double the value of global gold reserves. The ability of investors to shift en masse out of dollars to assets of similar liquidity and predictability is thus very limited.

What might it take to get debt under control?

To reverse the rise in the debt ratio, the U.S. will over time need to significantly reduce its budget deficit of 6-7%, which is politically challenging regardless of election outcome. Both revenues and expenditures are not far from their historical averages, leaving limited room for significant changes and suggesting that higher deficits seem more likely than lower ones.


While there are reasons to be optimistic that economic growth will outpace real interest rates, this is highly uncertain. If growth doesn’t exceed real rates, the debt situation could deteriorate rapidly.


In terms of the composition of spending, the majority of expenditure is mandatory, making it unlikely to see significant reductions. The increasing debt, combined with an aging population, poses significant challenges. In the U.S., unfunded entitlements and a peak in the working-age population are looming. This could lead to a peak in personal earnings and taxable workers, necessitating either a significant period of austerity, which could impact growth, or increased reliance on corporate taxes, which could affect equity valuations. This leaves taxes as the more plausible avenue for deficit reduction, though this too is fraught with political hurdles.


Holding the effective interest rate below the growth rate could help manage the debt but might raise inflation concerns. The Federal Reserve’s ability to maintain this balance is crucial. A large increase in risk premia and U.S. Treasuries becoming a credit product are very unlikely, but deficits continue to matter for the macro-outlook, including growth and inflation.

Bottom line

The sustainability of U.S. public debt is a complex issue with no easy answers. The current state of public finances means that lower deficits will be required over time although the political will remains absent. It might even be the case that a wake-up call from nervous investors is exactly the forcing mechanism that would make policymakers take notice. While a “credit event” is unlikely, the impact of high deficits on growth and inflation remains a key risk.

The composition of U.S. Treasury buyers is also salient: Today, the U.S. deficit is primarily financed by the private sector in the U.S., not foreign investors. This continues to suggest that for investors, concerns over debt levels should be weighed against the risk adjusted returns that U.S. Treasuries provide, including their role as safe havens in periods of volatility. Despite everything, Treasuries remain the asset of choice for global investors seeking liquid and relatively predictable returns.

tryggvi-gudmundsson-color-600x600

Tryggvi Gudmundsson is an economist with 15 years of industry experience (as of 12/31/2023). He holds a PhD from the London School of Economics and Political Science, master’s and bachelor’s degrees in economics from the University of Iceland. 

*Loremipsum* Text Atom - Used for authoring content disclosures not via DIG.

Investments are not FDIC-insured, nor are they deposits of or guaranteed by a bank or any other entity, so they may lose value.
Investors should carefully consider investment objectives, risks, charges and expenses. This and other important information is contained in the fund prospectuses and summary prospectuses, which can be obtained from a financial professional and should be read carefully before investing.
Statements attributed to an individual represent the opinions of that individual as of the date published and do not necessarily reflect the opinions of Capital Group or its affiliates. This information is intended to highlight issues and should not be considered advice, an endorsement or a recommendation.
All Capital Group trademarks mentioned are owned by The Capital Group Companies, Inc., an affiliated company or fund. All other company and product names mentioned are the property of their respective companies.
Use of this website is intended for U.S. residents only. Use of this website and materials is also subject to approval by your home office.
Capital Client Group, Inc.
This content, developed by Capital Group, home of American Funds, should not be used as a primary basis for investment decisions and is not intended to serve as impartial investment or fiduciary advice.