Retirement Income

Three volatility tips for retirees

KEY TAKEAWAYS

  • Diversify income sources
  • Create building blocks for income buckets
  • Consider the timing of withdrawals

Retirement changes all aspects of life, including investing. As a result, constructing an effective retirement-income portfolio requires a considerable shift in perspective.


When saving for retirement there is an emphasis on return, usually with defined time horizons, regular salary increases to help counter inflation and regular investing to take advantage of market declines. Living in retirement shifts the emphasis to income and preservation, with an unknown time horizon, and promotes portfolio-construction strategies that guard against inflation, volatility and market declines — the things that can devastate a retiree’s income.


Here are three ideas to consider for retirement-income planning that may help mitigate the effects of volatility.

1. Diversify income sources


A newly retired investor is still a long-term investor, but one who has likely started to take distributions. Diversification strategies that worked for accumulation in the past may not be suited for distribution in the future. This is particularly true now that the landscape has shifted for interest rates, inflation and volatility.


Combining income from multiple sources to create a diversified income stream in retirement can help to reduce the effects of certain risks. Income diversification can come from both negatively correlated — meaning when one asset class goes up, the other will often go down — and noncorrelated assets.


However, correlation is not a constant and can change based on market dynamics and various external factors. For example, in 2022 stocks and bonds declined in tandem in the face of rising interest rates, inflation and slowing economic growth. As a result of these losses, many risk-averse retirees may consider defensive stocks that are dividend payers which seek to provide income and capital appreciation potential. Higher dividend-paying stocks can offer more downside protection compared to low and non-dividend payers and may accomplish part of a portfolio’s income goal, leaving room for fixed income to meet other objectives such as inflation protection, income and capital preservation.


With noncorrelated assets, income is paid independently from the returns of the assets’ value, meaning their price movements are generally not influenced by market fluctuations. These assets can provide a buffer against market swings. Examples of noncorrelated assets are Social Security retirement benefits, pension income and most protected lifetime income benefits from annuities. With these assets, the income stream is typically insulated from negative market events and can provide stability of income.1


The portfolio reliance rate, which is the percentage of an individual’s retirement income that comes from their investment portfolio, can be a key factor in determining whether additional protected income is needed. How much of a portfolio is protected, however, by these streams of income can be difficult to determine. To help investors understand their exposure, Capital Group’s Portfolio Reliance Calculator can help estimate the level of protected income that may be needed for an investor’s unique situation.

2. Create building blocks for income buckets

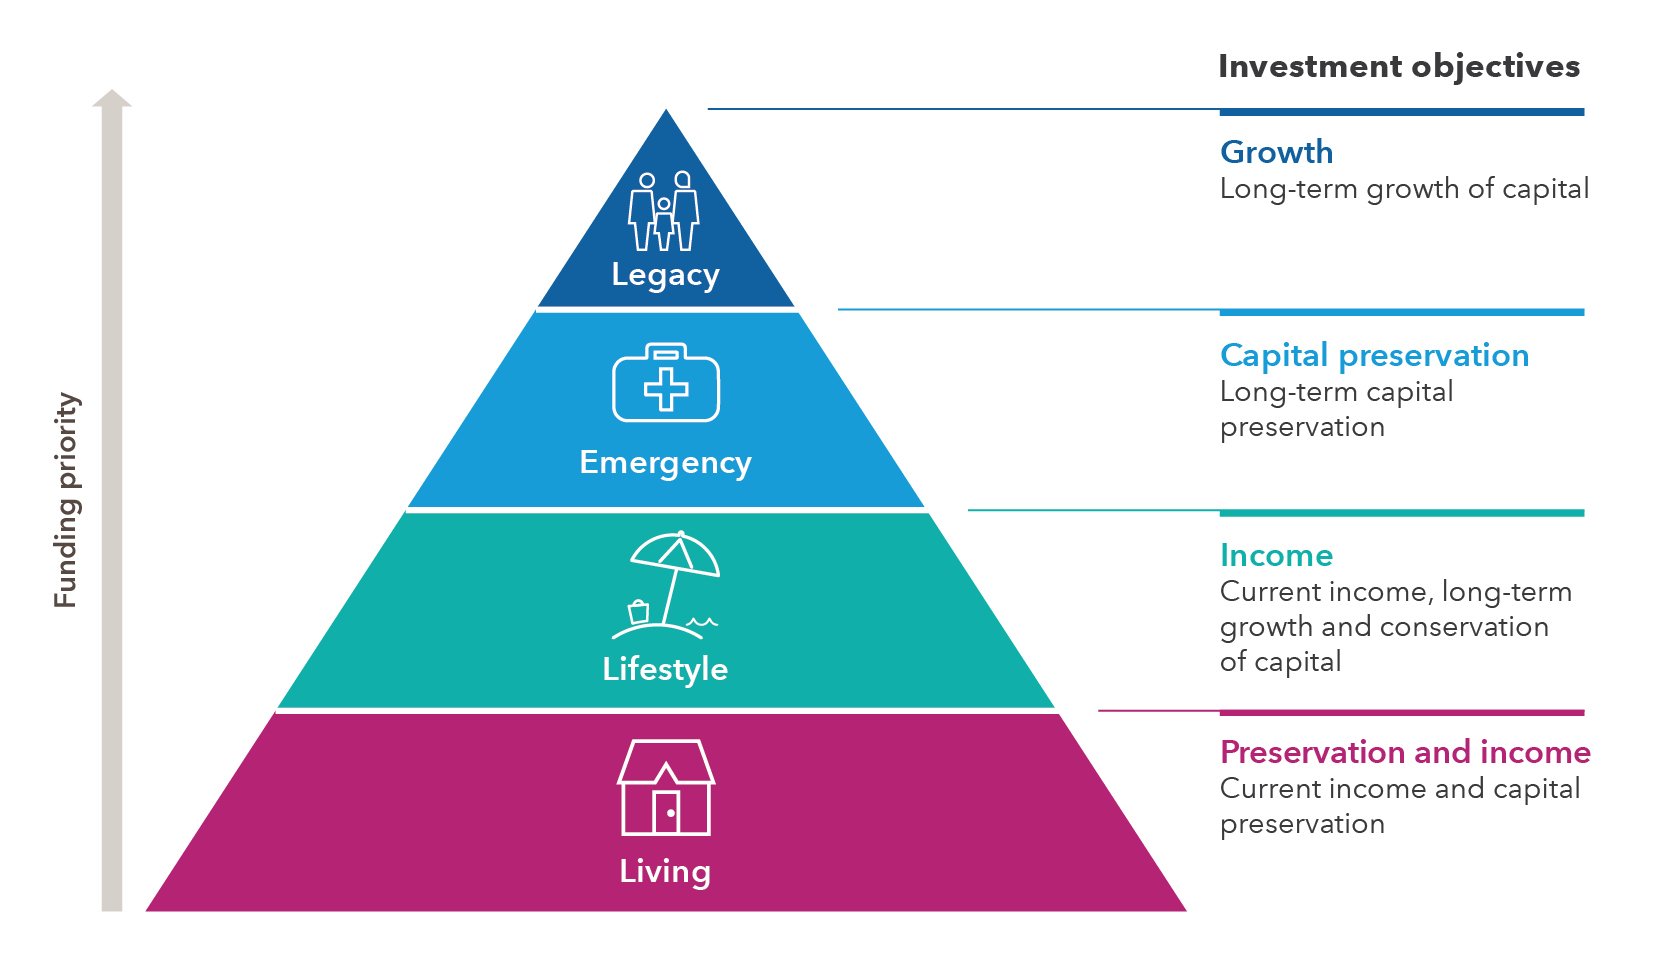
A pyramid displays four tiers of funding priorities for retirees, each with a corresponding investment objective. Going from largest to smallest, the tiers are: Living – Investment objective: Preservation and income. Current income and capital preservation. Lifestyle – Investment objective: Income. Current income, long-term growth and conservation of capital. Emergency – Investment objective: Capital preservation. Long-term capital preservation. Legacy – Investment objective: Growth. Long-term growth of capital.

Source: Capital Group.

There are many ways to build a bucket strategy, but consistency and maintenance are key. One method is to create asset allocation building blocks around the income objective. Four objectives frequently prioritized by retirees include:

Living: The base of the pyramid may consist of protected income sources like Social Security, pensions and annuities. Protected lifetime income helps ensure that retirees have a stable and reliable source of income to meet their day-to-day needs such as housing, food and health care. Investments that have the potential to offer stability, lower risk and income streams may also help to fill the gap. Examples may include dividend-paying stocks, high-quality bonds, real estate investment trusts (REITs) and mutual funds that are designed to generate income through a combination of dividends, interest and capital gains.

Lifestyle: This second layer is designed to support the lifestyle objectives of retirees and may include high-quality bonds, certificates of deposit (CDs) and money market funds. These investments seek to offer additional income beyond essential expenses, enabling retirees to enjoy discretionary spending on hobbies, travel and other lifestyle expenditures without taking on excessive risk.

Emergency: The third layer of the building blocks pyramid should comprise the diversified investment portfolio, which serves as a potential safety net to address emergency situations or unexpected expenses. While the assets in this layer may be aimed at growth and managing risk, they can be tapped into during unforeseen circumstances like medical emergencies or major home repairs, if necessary. This layer also helps to protect the lower levels from potential disruption.

Legacy: The top layer may include growth-oriented investments like growth stocks, global growth strategies such as emerging market equities, as well as life insurance, which aligns with the legacy objectives of investors. This layer would focus on growing and preserving wealth to leave a financial legacy so retirees may be able to pass on assets and wealth to the next generation or support causes they care about.

Bucket strategies, whether allocated by time and/or client objectives, can have the positive effect of helping retirees adopt a mental accounting framework for their assets, making it easier for them to understand, quantify and prioritize their retirement spending and legacy objectives. By diversifying across various asset classes and income sources, retirees may lower their exposure to market fluctuations and reduce the impact of a single economic event on their retirement income. This strategy also encourages retirees to take a comprehensive view of their financial goals, for both the short and long term. By addressing living, lifestyle, emergency and legacy objectives, retirees can create a more holistic and sustainable retirement plan that aligns with their values and aspirations.

3. Consider the timing of withdrawals


During accumulation, investors who make systematic investments often benefit from periodic drops in the price of an investment — referred to as dollar-cost averaging. But once the investor shifts to decumulation and begins to withdraw from their investment portfolio, selling investments at depressed prices during a market downturn can result in what many informally refer to as “dollar cost ravaging” — the liquidation of more shares to support the same level of income.


In addition, tapping into the portfolio in a bad market could permanently undermine the ability to participate in any future recoveries. While it is not possible to avoid all market volatility, using a flexible withdrawal strategy that adjusts income in response to changes in markets may help provide better control over the timing of when shares of certain assets are sold during poor market conditions and help mitigate the effect of market volatility — and thus potentially decrease the risk of running out of money.


It is important for retirees to assess the tradeoff between the amount of income wanted versus the amount accessible and ending wealth during their retirement. In addition to these goals, some retirees might have a desire to leave a legacy. A stated priority to have enough money available to leave a legacy often means that they must accept reduced income throughout their retirement in order to better preserve assets to meet this goal.


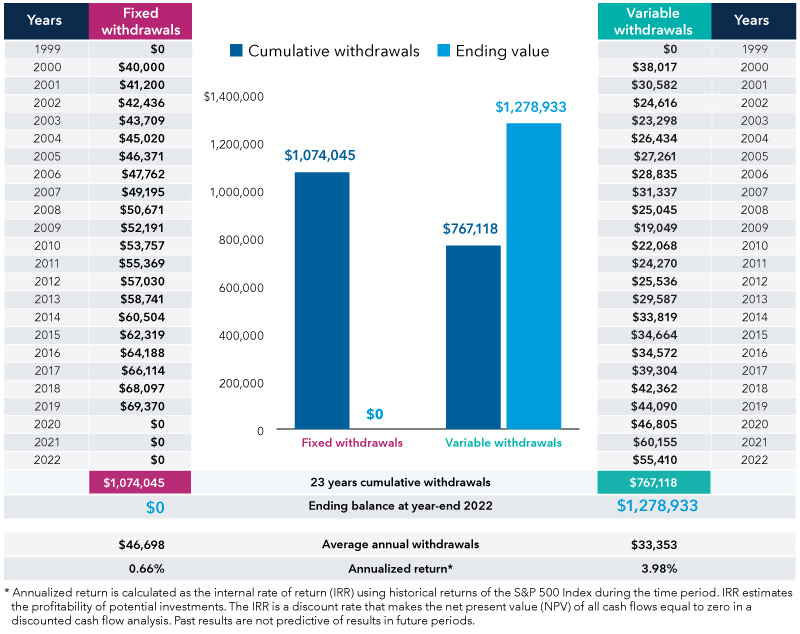
As shown in the chart below, a variable withdrawal approach is flexible and may improve portfolio longevity by adjusting withdrawals in response to markets, whereas a fixed withdrawal strategy that is a constant — adjusted for 4% inflation per year — would result in a more rapidly depleted portfolio balance under volatile market conditions.

Maximizing portfolio longevity: the key role of timing and variable withdrawals

The chart depicts fixed and variable withdrawal scenarios over 23 years from 1999 to 2022. The fixed withdrawal scenario is displayed on the left with 23 years of withdrawals and the amount per year, respectively. 1999: $0; 2000: $40,000; 2001: $41,200; 2002: $42,436; 2003: $43,709; 2004: $45,020; 2005: $46,371; 2006: $47,762; 2007: $49,195; 2008: $50,671; 2009: $52,191; 2010: $53,757; 2011: $55,369; 2012: $57,030; 2013: $58,741; 2014: $60,504; 2015: $62,319; 2016: $64,188; 2017: $66,114; 2018: $68,097; 2019: $69,370; 2020: $0; 2021: $0; 2022: $0. 23 years of cumulative withdrawals: $1,074,045. Ending balance at year-end 2022: $0. Average annual withdrawals: $46,698. Annualized return: 0.66%. The variable withdrawal scenario is displayed on the right with 23 years of withdrawals and the amount per year, respectively. 1999: $0; 2000: $38,017; 2001: $30,582; 2002: $24,616; 2003: $23,298; 2004: $26,434; 2005: $27,261; 2006: $28,835; 2007: $31,337; 2008: $25,045; 2009: $19,049; 2010: $22,068; 2011: $24,270; 2012: $25,536; 2013: $29,587; 2014: $33,819; 2015: $34,664; 2016: $34,572; 2017: $39,304; 2018: $42,362; 2019: $44,090; 2020: $46,805; 2021: $60,155; 2022: $55,410. 23 years of cumulative withdrawals: $767,118. Ending balance at year-end 2022: $1,278,933. Average annual withdrawals: $33,353. Annualized return: 3.98%. Annualized return is calculated as the internal rate of return (IRR) Annualized return is calculated as the internal rate of return (IRR) using historical returns of the S&P 500 during the time period.  IRR estimates the profitability of potential investments.  The IRR is a discount rate that makes the net present value (NPV) of all cash flows equal to zero in a discounted cash flow analysis. IRR estimates the profitability of potential investments. The IRR is a discount rate that makes the net present value (NPV) of all cash flows equal to zero in a discounted cash flow analysis. Past results are not predictive of results in the future periods.

Source: Capital Group. The above chart is a hypothetical example and is not representative of actual portfolios or withdrawals. Both hypothetical withdrawal strategies assume a starting balance of $1,000,000, with an annual 1% fee and a 4% annual withdrawal rate. The initial annual withdrawal amount for the fixed strategy of $40,000 is calculated by multiplying the initial investment amount by 4%, which is divided by 12 to determine the first-year monthly withdrawal amount of $3,333.33. After the first year, the fixed strategy withdrawal amount increases by 3% each year to account for inflation. The withdrawal amount for the variable strategy is determined by taking 1/12 of 4% — or 0.33% — of the month-end balance each month.

Take the next step


Building and preserving assets for the future requires understanding both the tradeoff between risk and return and managing volatility. To that end, here are some steps you can take to move closer to doing so:
 

  1. Do a portfolio checkup: Periodically review the retirement income plan to ensure that it continues to reflect a client’s objectives. Amid changing market conditions, the plan can help them stay focused on long-term goals rather than short-term market movements.
  2. Review investment portfolio reliance: The reliance rate tells you how much you rely on your portfolio — rather than other sources, such as Social Security — for your income in retirement. One way to help lower the reliance rate is to invest in an annuity, which can provide a lifetime income stream that isn’t subject to movements in the stock market. While an annuity is not for everyone, the Portfolio Reliance Calculator can be useful to help assess its usefulness in relation to income objectives.
  3. Examine the withdrawal strategy: If the portfolio value drops, consider making changes to the strategy and/or spending. It is impossible to predict when a market downturn may end and the next market rally could begin. So, try to avoid selling in down markets when possible, forgoing an annual withdrawal increase, or even temporarily lowering withdrawals by reducing your spending.
KTEB

Kate Beattie is a senior retirement income strategist with 17 years of investment industry experience (as of 12/31/2023). She holds a bachelor’s degree in economics with a business administration minor from Colorado State University and holds the Certified Financial Planner™ and Retirement Income Certified Professional® designations.

1Annuity account values are typically impacted.


S&P 500 Index is a market capitalization-weighted index based on the results of approximately 500 widely held common stocks. This index is unmanaged, and its results include reinvested dividends and/or distributions but do not reflect the effect of sales charges, commissions, account fees, expenses or U.S. federal income taxes.

Investments are not FDIC-insured, nor are they deposits of or guaranteed by a bank or any other entity, so they may lose value.
Investors should carefully consider investment objectives, risks, charges and expenses. This and other important information is contained in the fund prospectuses and summary prospectuses, which can be obtained from a financial professional and should be read carefully before investing.
The indexes are unmanaged and, therefore, have no expenses. Investors cannot invest directly in an index.
Each S&P Index ("Index") shown is a product of S&P Dow Jones Indices LLC and/or its affiliates and has been licensed for use by Capital Group. Copyright © 2024 S&P Dow Jones Indices LLC, a division of S&P Global, and/or its affiliates. All rights reserved. Redistribution or reproduction in whole or in part is prohibited without written permission of S&P Dow Jones Indices LLC.
Statements attributed to an individual represent the opinions of that individual as of the date published and do not necessarily reflect the opinions of Capital Group or its affiliates. This information is intended to highlight issues and should not be considered advice, an endorsement or a recommendation.
All Capital Group trademarks mentioned are owned by The Capital Group Companies, Inc., an affiliated company or fund. All other company and product names mentioned are the property of their respective companies.
Use of this website is intended for U.S. residents only. Use of this website and materials is also subject to approval by your home office.
The Morningstar average expense ratios are based on fund statistics for each fund's prospectus available at the time of publication. The expense ratio is one aspect of plan fees and expenses.
Capital Client Group, Inc.
This content, developed by Capital Group, home of American Funds, should not be used as a primary basis for investment decisions and is not intended to serve as impartial investment or fiduciary advice.