Chart in Focus
Trade
- A series of mergers since 2015 has left many industries dominated by a few global giants.
- The semiconductor, health care services and media industries have seen the most consolidation.
- Consolidation brings benefits of scale, but also can draw regulatory scrutiny.
As a wave of mergers and acquisitions has swept the business world in recent years, more industries have come to be dominated by just a few massive companies. In many sectors, competitors have joined forces to build scale and drive innovation amid mature growth.
But the long-run success of these mega-companies is likely to vary. Consolidation delivers economies of scale but can make it harder to react nimbly to new competition or shifts in technology. Merged companies also may find themselves in the crosshairs of regulators concerned about concentrated market power.
We take a closer look at the merger wave in five charts:
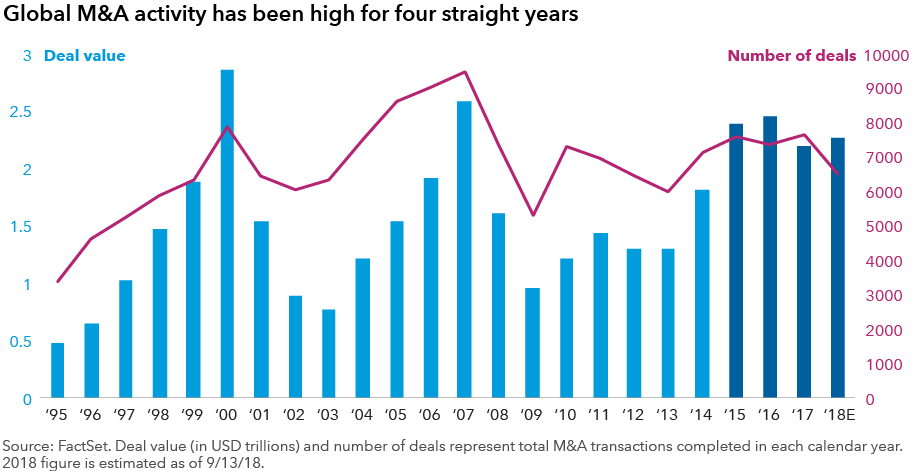
1. Global M&A activity has been high for four years.
Corporate consolidation has gained pace steadily since the global financial crisis, driven by a combination of cheap money and balance sheets boosted by a strong stock market. Although the sheer number of deals is not new, the size of the deals is historic and creating dominant companies.
This year is on track to be an unprecedented fourth consecutive year with more than $2 trillion in proposed M&A transactions. There have been more than two dozen deals valued at more than $10 billion each this year, most notably megadeals between Disney and 21st Century Fox, CVS and Aetna, and AT&T and Time Warner.

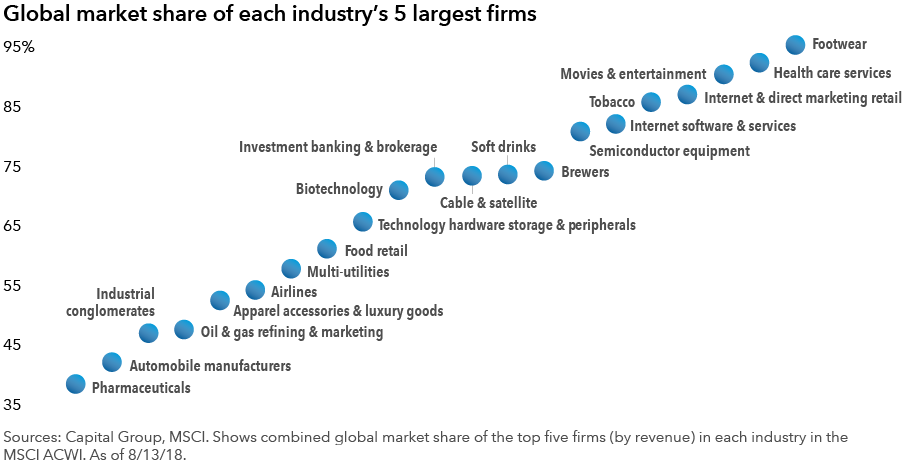
2. The consolidation wave has swept up many industries.
The surge in big mergers has left its mark across a range of industries, especially semiconductors, health care service providers and media. The heavy deal-making has created dominant players with tremendous influence over their industries and the broader economy.
“On the whole, consolidation makes companies more efficient and achieve better scale,” says equity portfolio manager Brad Freer.
As a result of the push for corporate mergers, many industries in the MSCI All Country World Index now are dominated by just a few big companies. Some of the highest concentrations are found in footwear, health care services and entertainment, where the top five companies stand head and shoulders above the rest with 90% or more of total industry revenue.
In the U.S. alone, a 2016 study found that more than 75% of industries have become increasingly concentrated as measured by the Herfindahl-Hirschman index, the metric used by government antitrust regulators.

3. The semiconductor sector exemplifies the dramatic consolidation.
The semiconductor industry is a prime example of consolidation over time. Like the ever-shrinking size of the transistors themselves, the number of top-tier players has shrunk dramatically since 2002.
Of course, the largest companies also make the smallest chips. The dominance of Intel, Taiwan Semiconductor and Samsung Electronics has allowed these companies to invest in massive research and development programs essential to keeping up with technological advances. Consolidation also has mitigated the boom-and-bust cycles that hurt the industry in prior decades.
“Consolidation has been good for shareholders,” says analyst Shailesh Jaitly. “Semiconductor companies are more rational and can focus on their core competencies.”
With more stable revenue streams and strong balance sheets, these companies began paying dividends a few years ago. They now are eligible to be held not just in growth portfolios but also income-oriented equity strategies, providing them with a much wider, deeper investor base.
![]()
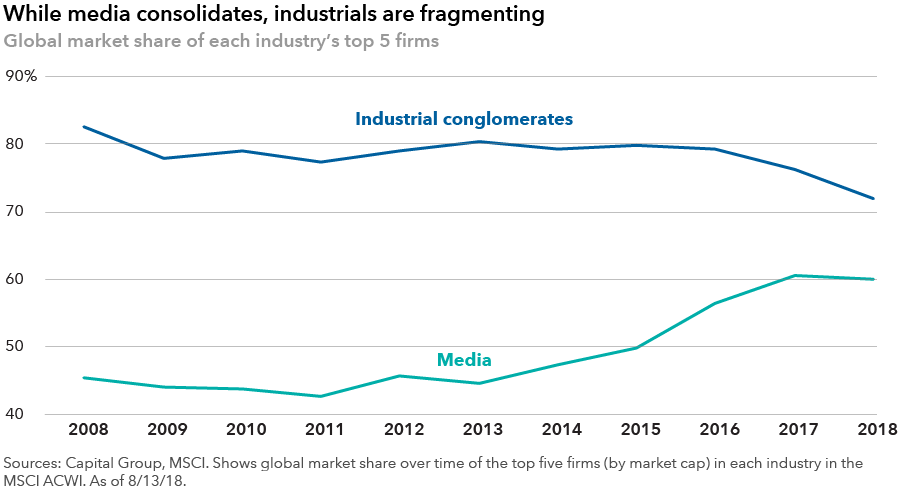
4. Consolidation is a two-way street: Some industries are fragmenting.
While industries such as semiconductors and media have been consolidating, big players in other sectors have been slimming down. For instance, industrial companies such as General Electric, Honeywell, Danaher and Illinois Tool Works have spun off businesses. Spin-offs often can be good for investors: The breakup of Tyco International into six separate companies from 2001 to 2014 achieved a higher return than the S&P 500 for the same period.
“When you become a smaller company focused on a smaller end market, you have more focus to drive the business and focus on results, and you have a currency in the business you’re running,” says portfolio manager Martin Jacobs.

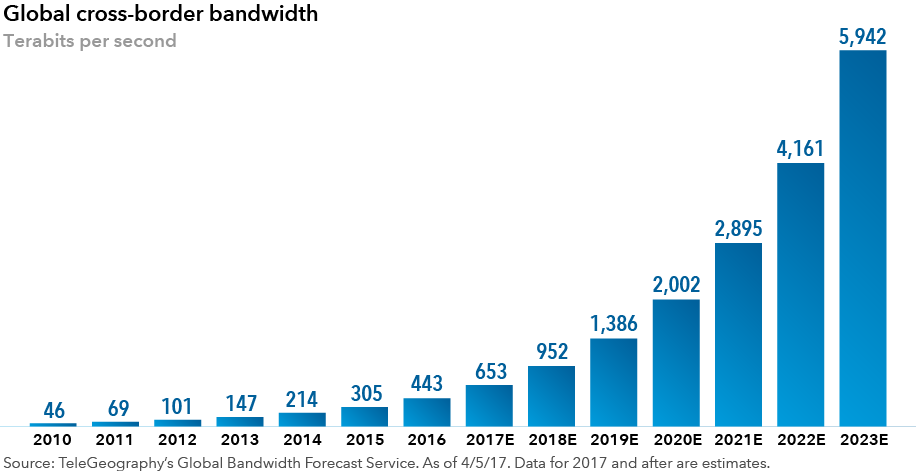
5. As digital traffic soars, technology giants face a tougher regulatory environment.
The digital world of data and commerce also is coming to be dominated by a few giants that have grown in part through acquiring smaller rivals — from Google parent Alphabet and Amazon to Tencent and Facebook. Outside of China, Google virtually owns the global search engine market. Facebook users worldwide account for about one-fourth of the global population.
Along with these companies, digital trade itself continues to expand. Cross-border digital traffic has grown 40 times larger since 2007 and is projected to grow exponentially in the next five years.

However, that growth has attracted the attention of regulators. As seen with the European Union's General Data Protection Regulation, which took effect earlier this year, regulators increasingly are seeking greater purview over issues of intellectual property, data storage and privacy. Digital companies will need to learn to navigate regulation to continue to succeed, just as Nike and other consumer companies had to do when facing challenges to their labor practices in developing countries.
Well-run multinationals are best positioned.
Of the global giants created by this wave of consolidation, some will thrive and others will become too large for their own good. It’s the job of professional investors to identify the ones that will succeed and prove to be good investments over the long term.
In many cases, “well-managed multinationals are the best-positioned companies to navigate an uncertain environment,” says portfolio manager Jody Jonsson. “They have the experience to navigate multiple regulatory regimes and the staying power to ride out business and economic cycles.”
Investing outside the United States involves risks, such as currency fluctuations, periods of illiquidity and price volatility, as more fully described in the prospectus. These risks may be heightened in connection with investments in developing countries.
MSCI does not approve, review or produce reports published on this site, makes no express or implied warranties or representations and is not liable whatsoever for any data represented. You may not redistribute MSCI data or use it as a basis for other indices or investment products.
The S&P 500 Composite Index (“Index”) is a product of S&P Dow Jones Indices LLC and/or its affiliates and has been licensed for use by Capital Group. Copyright © 2018 S&P Dow Jones Indices LLC, a division of S&P Global, and/or its affiliates. All rights reserved. Redistribution or reproduction in whole or in part are prohibited without written permission of S&P Dow Jones Indices LLC.
Our latest insights
-
-
Economic Indicators
-
Demographics & Culture
-
Emerging Markets
-
Never miss an insight
The Capital Ideas newsletter delivers weekly insights straight to your inbox.
Statements attributed to an individual represent the opinions of that individual as of the date published and do not necessarily reflect the opinions of Capital Group or its affiliates. This information is intended to highlight issues and should not be considered advice, an endorsement or a recommendation.
 Brad Freer
 Martin Jacobs
 Shailesh Jaitly