info
Some of our associates in Southern California are affected by the widespread wildfires. We are focused on ensuring that our associates who live in evacuation zones are safe and are saddened by the devastating impact to our Los Angeles communities. At this time, all of our offices are open and all investment operations are running normally. We will update this notice if needed, but we are confident that we will not experience any business impact from the wildfires. Please note that in observance of the National Day of Mourning to honor former President James Earl Carter, Jr., on Thursday, January 9, the New York Stock Exchange and Capital Group will be closed.

VARIABLE ANNUITIES

Study shows variable annuity investors outpaced others

KEY TAKEAWAYS

  • Variable annuities are designed to encourage longer term investment approaches. By staying invested over extended periods, investors can benefit from market upswings and the compounding of returns.
  • A 2024 study by DALBAR, a financial research firm, showed that higher average returns are observed among investors in variable annuity equity subaccounts than those in equity mutual funds.
  • This study can be used by financial professionals to educate clients on the benefits of long-term investment strategies, and the importance of avoiding short-term decisions motivated by emotion.

A recent study from DALBAR1 found that the average investor in a variable annuity equity subaccount achieved an average return of 23.59% in 2023, compared to an average gain of 20.79% for the average equity mutual fund investor. This discrepancy may be influenced by several contributing factors:
 

1.Strategic allocation: Variable annuity investors often allocate more to equity subaccounts,2 capturing a greater share of the equity market’s growth potential. This higher allocation provides the potential for higher returns than a lower allocation if equity markets rise.
 
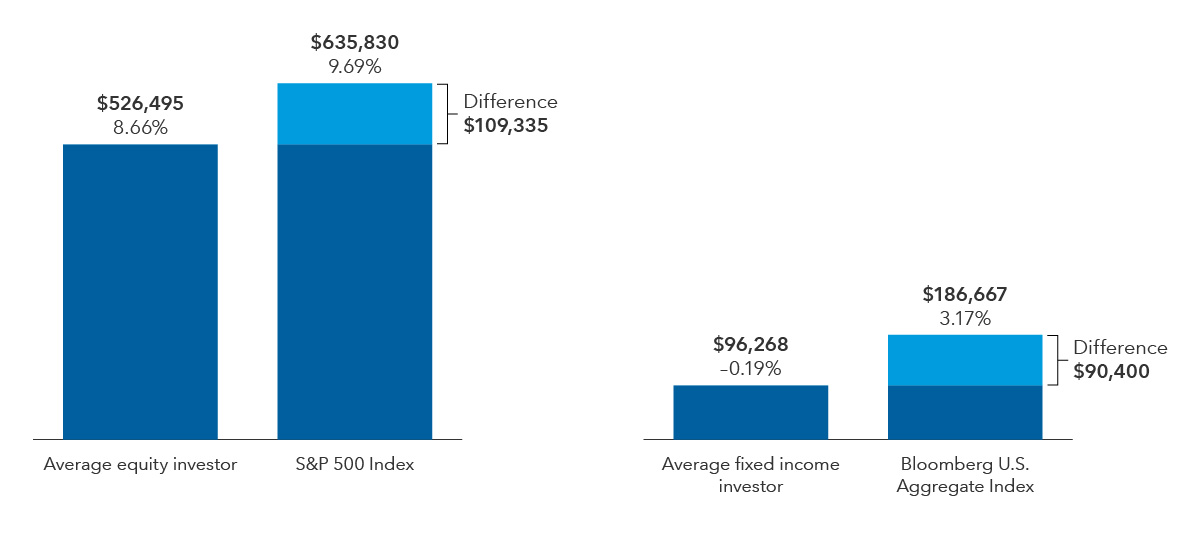
2.Long-term investment horizon: The structure of variable annuities supports a longer term investment approach, allowing those who stay invested to benefit from market growth and the effects of compounding returns over time. As shown in the charts below, remaining invested through all market stages, rather than trying to time market highs and lows, may be a better strategy to pursue long-term goals.

Growth of a hypothetical $100,000 investment and average annual total returns (12/31/03-12/31/23)3

Chart compares the growth of a hypothetical $100,000 investment and average annual total returns from 12/31/03 to 12/31/23 between the average equity investor and the average fixed income investor and related benchmarks. The average equity investor is shown with $526,495 and a return of 8.66%. The benchmark S&P 500 Index is shown with $635,830 and a return of 9.69%, a difference of $109,335. The average fixed income investor is shown with $96,268 and a return of -.19%, while the benchmark Bloomberg U.S. Aggregate Index is shown with $186,667 and a return of 3.17%, a difference of $90,400.

Sources: DALBAR, S&P Dow Jones Indices LLC., Bloomberg Index Services Ltd. Results are hypothetical.

3.Consistent income features: Variable annuities often include an optional rider that provides a guaranteed minimum income,4 which can support investors in maintaining their investment strategy. This steadiness may contribute to more stable and potentially higher returns over time, particularly in declining or volatile markets. 


4. Diversification: Many variable annuity subaccounts offer a diversified mix of investments, helping to manage risk while providing growth opportunities. This diversified approach can play a role in achieving higher returns over time.


5.Professional management: Variable annuity subaccounts can be managed by professional fund managers who actively adjust the portfolio to optimize returns. This professional oversight seeks to enhance returns through informed investment decisions.

Variable annuities offer unique advantages that may lead to higher-than-average returns for certain investors. While mutual funds and fixed income investments can help investors pursue their goals, variable annuities provide features that may be beneficial for certain investor needs, such as an insurance component that provides a death benefit.
 

Here are three practical ways financial professionals can leverage findings from the study to elevate client conversations:
 

  • Highlight the value of long-term investing: Educate clients on the benefits of a long-term investment approach and the potential drawbacks of frequent trading. The evidence of stronger returns and longer holding periods among variable annuity investors1 suggests that staying the course can help avoid emotional decisions that may impact returns.

  • Portfolio diversification and equity exposure: Clients may want to consider a diversified portfolio with a more significant equity component, tailored to their risk tolerance.

  • Regularly review and consider cash-flow adjustments: Routinely assess and adjust your client’s cash-flow strategies to ensure alignment with their financial goals and market conditions. 
KTEB

Kate Beattie is a senior retirement income strategist with 18 years of investment industry experience (as of December 31, 2024). She holds a bachelor’s degree in economics with a business administration minor from Colorado State University and holds the Certified Financial Planner™ and Retirement Income Certified Professional® designations.

DALBAR, Inc., 2024 QAIB-VA Report, www.dalbar.com
 

The average investor in a variable annuity subaccount has 80% of their portfolio in equities compared with the average mutual fund investor who has 74% in equities (similar to 2022, when allocations were 80% and 72%, respectively).
 

Returns for average equity and fixed-income investors calculated by DALBAR. DALBAR uses data from the Investment Company Institute (ICI), Standard & Poor’s, Bloomberg and proprietary sources to compare mutual fund investor returns to an appropriate set of benchmarks. These results are then compared to the returns of respective indexes. Ending values for the indexes and hypothetical equity and fixed-income investor investments are based on average annual total returns.
 

These features often come at an additional cost to the policyholder.
 

DALBAR's Quantitative Analysis of Investor Behavior (QAIB) uses data from the Investment Company Institute (ICI), Standard & Poor’s and proprietary sources to compare the average equity subaccount investor (“Average Subaccount Investor”) returns to the average mutual fund investor (“Average Mutual Fund Investor”) and an appropriate benchmark. Covering the period from January 1, 2000, to December 31, 2023, the study utilizes variable annuity equity and fixed income subaccount sales, redemptions and exchanges each month as the measure of investor behavior. These behaviors reflect the “Average Investor.” Based on this behavior, the analysis calculates the “average investor return” for various periods. 
 

Past results are not predictive of results in future periods.


The market indexes are unmanaged and, therefore, have no expenses. Investors cannot invest directly in an index.


Variable annuities are long-term investment products designed for retirement purposes and are subject to market fluctuation, investment risk, and possible loss of principal. Variable annuities contain both investment and insurance components and have fees and charges, including mortality and expense, administrative, and advisory fees. Optional features are available for an additional charge. The annuity's value fluctuates with the market value of the underlying investment options, and all assets accumulate tax deferred. Withdrawals of earnings are taxable as ordinary income and, if taken prior to age 59½, may be subject to an additional 10% federal tax. Withdrawals will reduce the death benefit and cash surrender value.


Bloomberg U.S. Aggregate Index represents the U.S. investment-grade fixed-rate bond market.


S&P 500 Index is a market capitalization-weighted index based on the results of approximately 500 widely held common stocks.


“Bloomberg®” and Bloomberg U.S. Aggregate Index are service marks of Bloomberg Finance L.P. and its affiliates, including Bloomberg Index Services Limited (“BISL”), the administrator of the index (collectively, “Bloomberg”) and have been licensed for use for certain purposes by Capital Group. Bloomberg is not affiliated with Capital Group, and Bloomberg does not approve, endorse, review, or recommend Capital Group products. Bloomberg does not guarantee the timeliness, accurateness, or completeness of any data or information relating to Capital Group products.


The S&P 500 Index (“Index”) is a product of S&P Dow Jones Indices LLC and/or its affiliates and has been licensed for use by Capital Group. Copyright © 2024 S&P Dow Jones Indices LLC, a division of S&P Global, and/or its affiliates. All rights reserved. Redistribution or reproduction in whole or in part is prohibited without written permission of S&P Dow Jones Indices LLC.

Investments are not FDIC-insured, nor are they deposits of or guaranteed by a bank or any other entity, so they may lose value.
Investors should carefully consider investment objectives, risks, charges and expenses. This and other important information is contained in the fund prospectuses and summary prospectuses, which can be obtained from a financial professional and should be read carefully before investing.
Statements attributed to an individual represent the opinions of that individual as of the date published and do not necessarily reflect the opinions of Capital Group or its affiliates. This information is intended to highlight issues and should not be considered advice, an endorsement or a recommendation.
All Capital Group trademarks mentioned are owned by The Capital Group Companies, Inc., an affiliated company or fund. All other company and product names mentioned are the property of their respective companies.
Use of this website is intended for U.S. residents only. Use of this website and materials is also subject to approval by your home office.
Capital Client Group, Inc.
This content, developed by Capital Group, home of American Funds, should not be used as a primary basis for investment decisions and is not intended to serve as impartial investment or fiduciary advice.