DEFINED CONTRIBUTION
Benchmark retirement plans for success
Retirement plan benchmarking can help you get and stay ahead of your competition:
- Identify and highlight plan and service offering strengths
- Discover weaknesses to address
- Prove your value and strengthen client relationships
If you’re not benchmarking your retirement plans, don’t be surprised if someone else is.
What is benchmarking?
Benchmarking involves assessing something — such as a feature, product, service or process — by comparing it to an accepted standard or competitors. It’s probably more common than you realize — you’re doing a form of benchmarking when you compare prices while shopping or when you monitor your diet.
How to benchmark
You can benchmark any aspect of your plans or practice. Here are some specific areas to benchmark and tools that can help:
Fees
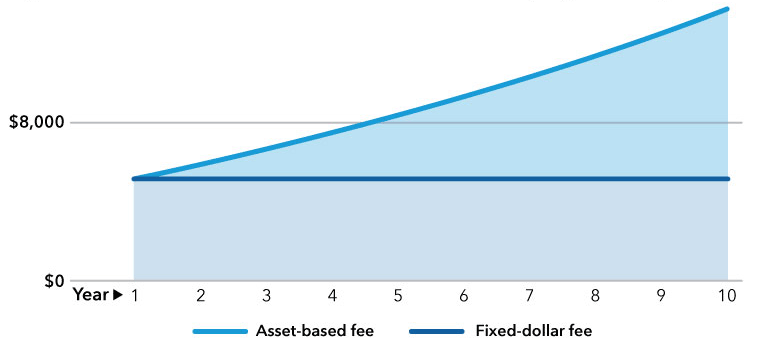
Are plan fees reasonable? Competitive? Transparent? At right you can see how an asset-based fee might compare to a fixed-dollar fee over time.
Use Retirement Planalyzer® to analyze and compare the costs of different plans.
Hypothetical fixed-dollar vs. asset-based recordkeeping fee comparison*
Investment menus
What investments does/should the plan offer? Are there enough choices (or too many)? Do the funds have strong returns? Is there an appropriate qualified default investment alternative? (A QDIA is the investment used if participants don't choose one.)
With Retirement Planalyzer, you can view fund returns, expenses and other data to help you assess investment menus.
You can also get a comprehensive evaluation of target date series with Target Date ProView.
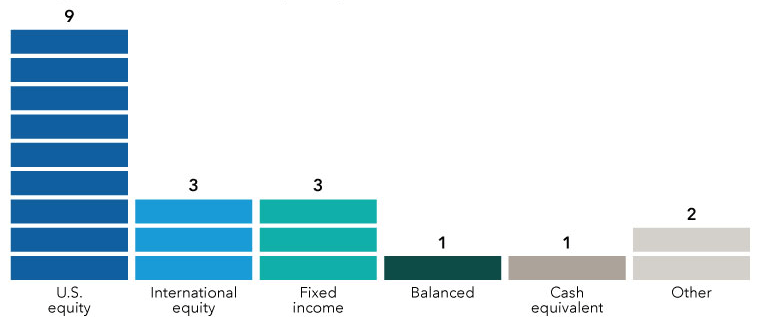
Are there too many DC menu choices?
Average number of core menu options per asset class†
Compensation
Are you charging plan sponsors too much or too little for your services? How does your compensation compare with that of your competition?
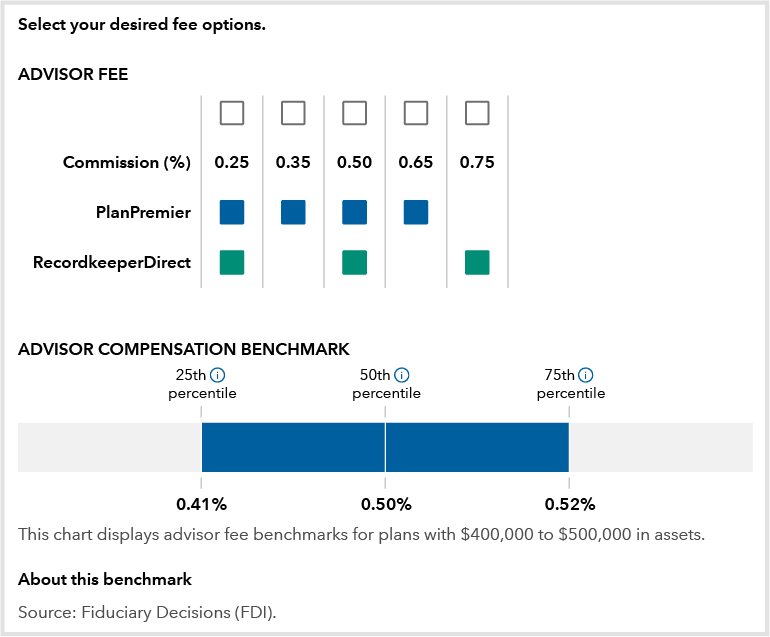
Retirement Planalyzer shows benchmark compensation for similar-size plans to help you select an appropriate solution and share class for your clients.
Set the right compensation with Retirement Planalyzer‡
Putting it all together
While it’s important to benchmark specific aspects of each plan, remember that sponsor clients and prospects are ultimately assessing their retirement plan experience holistically. Using Retirement Planalyzer to assess yourself and your plan offerings can help you benchmark your entire RP practice — and outshine your competition.
For more information and resources about Capital Group’s retirement plan solutions and investments, visit the Retirement plan solution center.
Your retirement plan counselor is ready to help you benchmark plans for success.
* The hypothetical fixed-dollar fee is based on a plan with $2.5 million in assets and 50 participants and is $5,200, or 0.21% of assets. The hypothetical asset-based fee starts at the same level as the fixed-dollar fee in the first year and applies the same 0.21% rate to plan assets with plan contributions of $150,000 and a growth rate of 8% added at the end of each year starting with year 2. Hypothetical results are for illustrative purposes only and in no way represent actual results.
† Source: BrightScope and Investment Company Institute, 2022. The BrightScope/ICI Defined Contribution Plan Profile: A Close Look at 401(k) Plans, 2019. Cash equivalent funds, or money funds, generally invest in short-term securities such as U.S. Treasury bills and CDs and, although not guaranteed, aim to preserve investment value. “Other” includes guaranteed investment contracts, commodity funds, real estate funds, and individual stocks (including company stock) and bonds. The sample is 58,158 plans with 59.5 million participants and $5.2 trillion in assets. Participant loans are excluded. Funds include mutual funds, collective investment trusts, separate accounts, and other pooled investment products. BrightScope-audited 401(k) filings generally include plans with 100 participants or more. Plans with fewer than four investment options or more than 100 investment options are excluded from BrightScope-audited 401(k) filings for this analysis.
‡ This image taken from Planalyzer for a hypothetical plan on August 30, 2023. Benchmark data is provided by Fiduciary Decisions (FDI) and shows median plan costs for similar plans. The 50th percentile benchmark shown is the median amount reported for all similar plans. Since fees and services vary, and to reflect the typical range for similar plans, the 25th and 75th percentile are also shown. The percentiles refer to the percentages of reported amounts that are equal to or less than the amounts shown. Percentile ranks, like percentages, fall on a continuum from zero to 100. The 75th percentile indicates that 75% of benchmark group plans reported amounts that were at or below the amount shown.


