Categories
Equity
Canadian Focused Equity: Seeking the best of Canada and the world
 Jeremy Burge
 Kathrin Forrest
June 10, 2024
For advisor use only. Not for use with investors.
What does a uranium miner, software company and dollar store operator have in common?
They’re among the top decile of companies in the MSCI All Country World Index (ACWI) for total returns over the five years ending March 31, 2024. And they also happen to be Canadian companies: Cameco, Constellation Software and Dollarama.
Surprised?
Some investors might be, but they may be more surprised to find out there’s more than a few Canadian companies in the top 300 of the nearly 3,000 companies from 50 countries in the global benchmark. Shopify, WSP Global and Loblaw are some of the others, as shown in the table below. It’s also worth noting that as of March 31, 2024, Canadian Natural Resources, Cameco and Imperial Oil are in the top 10 for returns in the MSCI ACWI’s energy sector, and Hydro One and AltaGas are in the top 10 for returns in the utilities sector for the same five-year period.
Canadian leaders
Canadian companies among the top 300 in returns
MSCI ACWI over 5 years from March 31, 2019, to March 31, 2024
Security |
Cumulative index return % |
GICs sector |
Country |
|---|---|---|---|
Shopify |
278.8% |
Information technology |
Canada |
Cameco |
278.2% |
Energy |
Canada |
Canadian Natural Resources |
248.2% |
Energy |
Canada |
Constellation Software |
234.6% |
Information technology |
Canada |
WSP Global |
223.6% |
Industrials |
Canada |
Dollarama |
193.2% |
Consumer discretionary |
Canada |
Imperial Oil |
184.7% |
Energy |
Canada |
Thomson Reuters |
182.0% |
Industrials |
Canada |
Fairfax Financial |
154.4% |
Financials |
Canada |
Lundin Mining |
153.2% |
Materials |
Canada |
Cenovus Energy |
148.4% |
Energy |
Canada |
Loblaw |
142.1% |
Consumer staples |
Canada |
Source: FactSet. GICS = Global Industry Classification Standard.
“Canada has many excellent, investable companies,” says Jeremy Burge, equity portfolio manager of Capital Group Canadian Focused Equity FundTM (Canada), which was launched in 2006.
To underline the opportunity, Canadian Focused Equity, which can invest a portion of the portfolio outside Canada, has primarily derived its results inside the country, not outside.
As shown in the chart below, the engine of Canadian Focused Equity’s results over the past five years has been Canada. This is measured by the fund’s active contribution, or excess results achieved above the benchmark in a particular country. As you can see, the margin of results is clearly tilted to Canada, as is portfolio weight.
Home sweet home
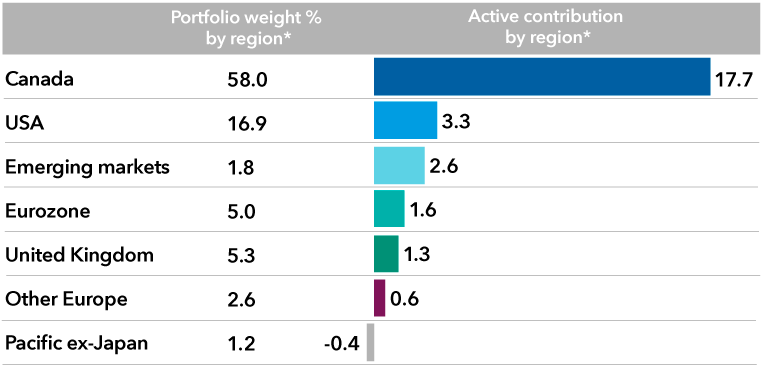
*Excludes cash.
Reflects Canadian Focused Equity vs. S&P/TSX Composite Index 5-year attribution by region based on quarter-end data from March 31, 2019, to March 31, 2024. Sources: Capital Group, FactSet.
“We’re doing what the TSX is attempting to do — produce superior Canadian equity returns in Canadian dollars for Canadians — but we do this by selecting different companies, in different amounts at different times to those offered in the TSX,” says Burge.
This is evident in the top 10 companies held by weight, or percentage of holdings, in Canadian Focused Equity as compared to the S&P/TSX. As you can see below, there’s only one shared holding between the two: Canadian Natural Resources. Further, three holdings in the fund’s top 10 are based outside of Canada.
“Nevertheless,” says equity investment specialist Kathrin Forrest, “the fund is firmly anchored to Canada.”
Same core focus, different holdings
Top 10 holdings of Canadian Focused Equity and the S&P/TSX
As of March 31, 2024
Canadian Focused Equity |
Weight (%) |
S&P/TSX |
Weight (%) |
|---|---|---|---|
Canadian Natural Resources |
4.8 |
Royal Bank of Canada |
6.1 |
Tourmaline Oil |
3.8 |
Toronto-Dominion Bank |
4.6 |
Restaurant Brands International |
3.8 |
Shopify |
4.0 |
Broadcom |
3.1 |
Canadian Pacific Kansas City |
3.5 |
BAE Systems |
3.1 |
Canadian Natural Resources |
3.5 |
Imperial Oil |
2.9 |
Enbridge |
3.3 |
Fairfax Financial |
2.8 |
Canadian National Railway |
3.3 |
Brookfield Asset Management |
2.5 |
Bank of Montreal |
3.0 |
TSMC |
2.4 |
Bank of Nova Scotia |
2.7 |
Labrador Iron Ore Royalty |
2.3 |
Brookfield Corporation |
2.6 |
Total |
31.5 |
Total |
36.6 |
Source: Capital Group.
Interestingly, there’s not a single bank in Canadian Focused Equity’s top 10 and only one in the top 25 (Royal Bank of Canada is #11 as of March 31, 2024), compared to four in the benchmark’s top 10.
“The purpose behind the ability to invest outside Canada is to improve the quality and diversity of your holdings and reduce the cyclicality, volatility and risk associated with the TSX,” says Burge.
According to Burge, the reason to invest outside Canada and the S&P/TSX stems from the underlying composition of the benchmark itself.
“The TSX lacks choice, depth, quality and/or exposure to important themes we like in a number of industry sectors, such as information technology, industrials and health care,” he says.
A good example of Canadian Focused Equity using non-Canadian companies to improve the quality and diversity of its holdings is in information technology (IT), a notoriously underrepresented sector in Canada compared to the U.S. — a scant ten domestic companies are in the Canadian equities benchmark, all IT services or software related. Canadian Focused Equity in turn, complements its IT investments with Taiwan-based TSMC and U.S.-based Broadcom, among others, with the previously mentioned in the semiconductor industry.
The companies add single company, industry and geographic diversification as well as quality — in the form of dividends — to the portfolio’s Canadian IT companies. TSMC and Broadcom also expose investors to a newer important investment theme: artificial intelligence.
“The goal is to combine the best of Canada with the best in the world,” says Forrest.
Regarding cyclicality, volatility and risk, Canadian Focused Equity has been able to mitigate all three thanks to this broader regional scope, which allows portfolio managers to be more selective in Canada. To illustrate, a line graph below plots the upside, downside and blended capture ratios of the fund since its 2006 inception through March 31, 2024. The fund’s upside ratio shows it captures less upside than the TSX over time, but also less downside. When blended, anything above 1 in the upside/downside overall capture ratio suggests a smoother, more stable investment experience when compared to the TSX.
“A lower downside capture than the TSX has always been important for Canadian Focused Equity and the chart shows just how well and consistently this has been achieved,” says Burge.
Less downside
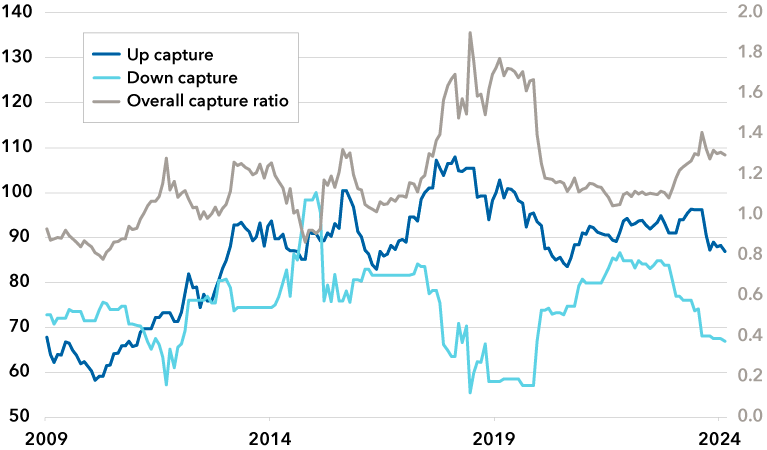
Canadian Focused Equity upside/downside ratio vs. S&P/TSX, lifetime (March 31, 2006 – March 31, 2024). The right axis reflects overall capture ratio data. Source: Capital Group.
“Providing a stable, smoother pattern of results is important to some investors. It may, for example, allow them to better maintain their investment course, avoid emotion-driven decisions, and help them achieve their financial goals with greater consistency,“ says Forrest.
Of course, along with mitigated risk, results are also important, particularly when Canadian equities have generally lagged U.S. equities for nearly a decade.
“Superior, long-term results are achievable in Canada,” says Burge, “but you have to find the companies able to deliver them and construct a portfolio with the right mix.”
Learn more about
Our latest insights
-
-
Currencies
-
Market Volatility
-
Market Volatility
-
Markets & Economy
RELATED INSIGHTS
-
-
Long-Term Investing
-
This content is confidential and designed for the exclusive use of registered dealers and their representatives. Canadian securities legislation, including National Instrument 81-102, prohibits its distribution to investors, potential investors or the general public. It is not intended to be a sales communication, as defined in the Instrument, and has not been designed to comply with its requirements relating to sales communications.
Unless otherwise indicated, the investment professionals featured do not manage Capital Group‘s Canadian investment funds.
References to particular companies or securities, if any, are included for informational or illustrative purposes only and should not be considered as an endorsement by Capital Group. Views expressed regarding a particular company, security, industry or market sector should not be considered an indication of trading intent of any investment funds or current holdings of any investment funds. These views should not be considered as investment advice nor should they be considered a recommendation to buy or sell.
Statements attributed to an individual represent the opinions of that individual as of the date published and do not necessarily reflect the opinions of Capital Group or its affiliates. This information is intended to highlight issues and not be comprehensive or to provide advice. For informational purposes only; not intended to provide tax, legal or financial advice. Capital Group funds are available in Canada through registered dealers. For more information, please consult your financial and tax advisors for your individual situation.
Forward-looking statements are not guarantees of future performance, and actual events and results could differ materially from those expressed or implied in any forward-looking statements made herein. We encourage you to consider these and other factors carefully before making any investment decisions and we urge you to avoid placing undue reliance on forward-looking statements.
The S&P 500 Composite Index (“Index”) is a product of S&P Dow Jones Indices LLC and/or its affiliates and has been licensed for use by Capital Group. Copyright © 2025 S&P Dow Jones Indices LLC, a division of S&P Global, and/or its affiliates. All rights reserved. Redistribution or reproduction in whole or in part are prohibited without written permission of S&P Dow Jones Indices LLC.
FTSE source: London Stock Exchange Group plc and its group undertakings (collectively, the "LSE Group"). © LSE Group 2025. FTSE Russell is a trading name of certain of the LSE Group companies. "FTSE®" is a trade mark of the relevant LSE Group companies and is used by any other LSE Group company under licence. All rights in the FTSE Russell indices or data vest in the relevant LSE Group company which owns the index or the data. Neither LSE Group nor its licensors accept any liability for any errors or omissions in the indices or data and no party may rely on any indices or data contained in this communication. No further distribution of data from the LSE Group is permitted without the relevant LSE Group company's express written consent. The LSE Group does not promote, sponsor or endorse the content of this communication. The index is unmanaged and cannot be invested in directly.
BLOOMBERG® is a trademark and service mark of Bloomberg Finance L.P. and its affiliates (collectively “Bloomberg”). Bloomberg or Bloomberg’s licensors own all proprietary rights in the Bloomberg Indices. Neither Bloomberg nor Bloomberg’s licensors approves or endorses this material, or guarantees the accuracy or completeness of any information herein, or makes any warranty, express or implied, as to the results to be obtained therefrom and, to the maximum extent allowed by law, neither shall have any liability or responsibility for injury or damages arising in connection therewith.
The MSCI information may only be used for your internal use, may not be reproduced or redisseminated in any form and may not be used as a basis for or a component of any financial instruments or products or indices. None of the MSCI information is intended to constitute investment advice or a recommendation to make (or refrain from making) any kind of investment decision and may not be relied on as such. Historical data and analysis should not be taken as an indication or guarantee of any future performance analysis, forecast or prediction. The MSCI information is provided on an “as is” basis and the user of this information assumes the entire risk of any use made of this information. MSCI, each of its affiliates and each other person involved in or related to compiling, computing or creating any MSCI information (collectively, the “MSCI Parties”) expressly disclaims all warranties (including, without limitation, any warranties of originality, accuracy, completeness, timeliness, non-infringement, merchantability and fitness for a particular purpose) with respect to this information. Without limiting any of the foregoing, in no event shall any MSCI Party have any liability for any direct, indirect, special, incidental, punitive, consequential (including, without limitation, lost profits) or any other damages. (www.msci.com)
Capital believes the software and information from FactSet to be reliable. However, Capital cannot be responsible for inaccuracies, incomplete information or updating of the information furnished by FactSet. The information provided in this report is meant to give you an approximate account of the fund/manager's characteristics for the specified date. This information is not indicative of future Capital investment decisions and is not used as part of our investment decision-making process.
Indices are unmanaged and cannot be invested in directly. Returns represent past performance, are not a guarantee of future performance, and are not indicative of any specific investment.
All Capital Group trademarks are owned by The Capital Group Companies, Inc. or an affiliated company in Canada, the U.S. and other countries. All other company names mentioned are the property of their respective companies.
Capital Group funds are offered in Canada by Capital International Asset Management (Canada), Inc., part of Capital Group, a global investment management firm originating in Los Angeles, California in 1931. Capital Group manages equity assets through three investment groups. These groups make investment and proxy voting decisions independently. Fixed income investment professionals provide fixed income research and investment management across the Capital organization; however, for securities with equity characteristics, they act solely on behalf of one of the three equity investment groups.
The Capital Group funds offered on this website are available only to Canadian residents.