Market Volatility

MARKET VOLATILITY
Guide to current markets and client concerns
Insights, tools and resources from Capital Group to help you support clients and build your business during unsteady markets.
Featured

INSIGHT
Views on the collapse of SVB Financial
Capital Group analysts weigh in on the sudden collapse of SVB Financial and what it means for risks in the banking system and the trajectory of Fed rate hikes.
WEBINAR SERIES
Deep dive on markets
Join our investment team as we examine the forces roiling markets.
MARKETING LAB
Create and send timely, client-ready market insights with your brand. Share one article or an entire email newsletter
Become an Insider to get started.

COMPARISON TOOL
How have your investments held up?
Use our tool to compare your investments to their peers, including during volatile periods.
Market insights and analysis
Timely and actionable insights to help you make sense of the markets and guide your investment decisions.
-
Guide to recessions: 9 key things you need to knowOctober 11, 2024
-
Market Volatility
Guide to stock market recoveriesSeptember 30, 2024 -
Election
3 mistakes investors make during election yearsApril 12, 2024
Build your practice
Information and resources for client conversations and practice management.
FOR YOU
4 ways to stay calm when markets stumble
Consultations with experienced Capital Group portfolio, investment, and wealth strategists
FOR YOUR CLIENTS
MARKETING LAB
Create and send timely, client-ready market insights with your brand. Share one article or an entire email newsletter
Become an Insider to get started.
Investment results
See our current results for:
Equities
Fixed Income
Target Date

COMPARISON TOOL
How have your investments held up?
Use our tool to compare your investments to their peers, including during volatile periods.

Experience matters
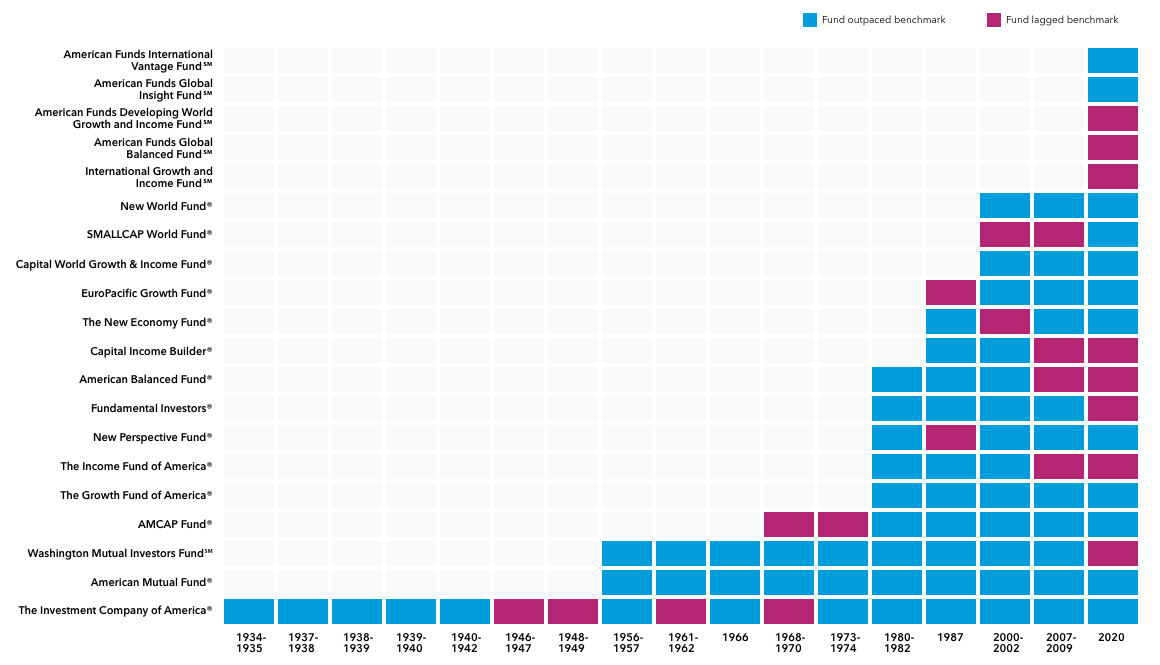
Throughout our history, we've weathered past storms. In fact, our equity-focused funds have outpaced their benchmark indexes during the biggest downturns of the last nine decades.
Across 17 bear markets, the equity-focused American Funds outpaced their benchmarks 77% of the time.
Sources: Capital Group, Morningstar. Class F-2 and R-6 shares with all distributions reinvested. View fund expense ratios and returns.
Dates shown for bear markets are based on price declines of 20% or more (without dividends reinvested) in the unmanaged S&P 500 with at least 50% recovery between declines. Funds shown are the equity-focused American Funds in existence at the time of each decline. Fund and benchmark returns are based on total returns.
Class F-2 shares were first offered on August 1, 2008. Class F-2 share results prior to the date of first sale are hypothetical based on Class A share results without a sales charge, adjusted for estimated annual expenses. The results shown are before taxes on fund distributions and sale of fund shares. Past results are not predictive of results in future periods. Results for other share classes may differ.
Class R-6 shares were first offered on May 1, 2009. Class R-6 share results prior to the date of first sale are hypothetical based on Class A share results without a sales charge, adjusted for typical estimated expenses. Please see the fund’s prospectus for more information on specific expenses.
Benchmark indexes for the funds: S&P 500 (ICA, AMF, WMIF, AMCAP, GFA, FI); MSCI World (NPF, WGI, GIF); 60% S&P 500 / 40% Bloomberg Barclays U.S. Aggregate (AMBAL); 65% S&P 500 / 35% Bloomberg U.S. Aggregate (IFA); 70% MSCI ACWI / 30% Bloomberg Barclays U.S. Aggregate (CIB); S&P 500 prior to the 2020 bear market, MSCI ACWI thereafter (NEF); MSCI EAFE prior to the 2007-09 bear market, MSCI ACWI ex USA thereafter (EUPAC); MSCI ACWI Small Cap (SMALLCAP); MSCI ACWI (NWF); MSCI ACWI ex USA (IGI), 60% MSCI ACWI / 40% Bloomberg Barclays Global Aggregate (GBAL); MSCI Emerging Markets (DWGI); MSCI EAFE (IVE)